For the first time in more than a year, Fraser Valley home sales posted a year-over-year increase. Benchmark prices also ticked up for the second consecutive month — small gains, but the direction matters. After a long stretch of buyer-favoured conditions, April showed the first concrete signs that the market is starting to find its footing.
Here's the full breakdown of what happened in April, what the numbers mean, and where things stand for buyers and sellers in Surrey and across the Fraser Valley.
The Big Picture
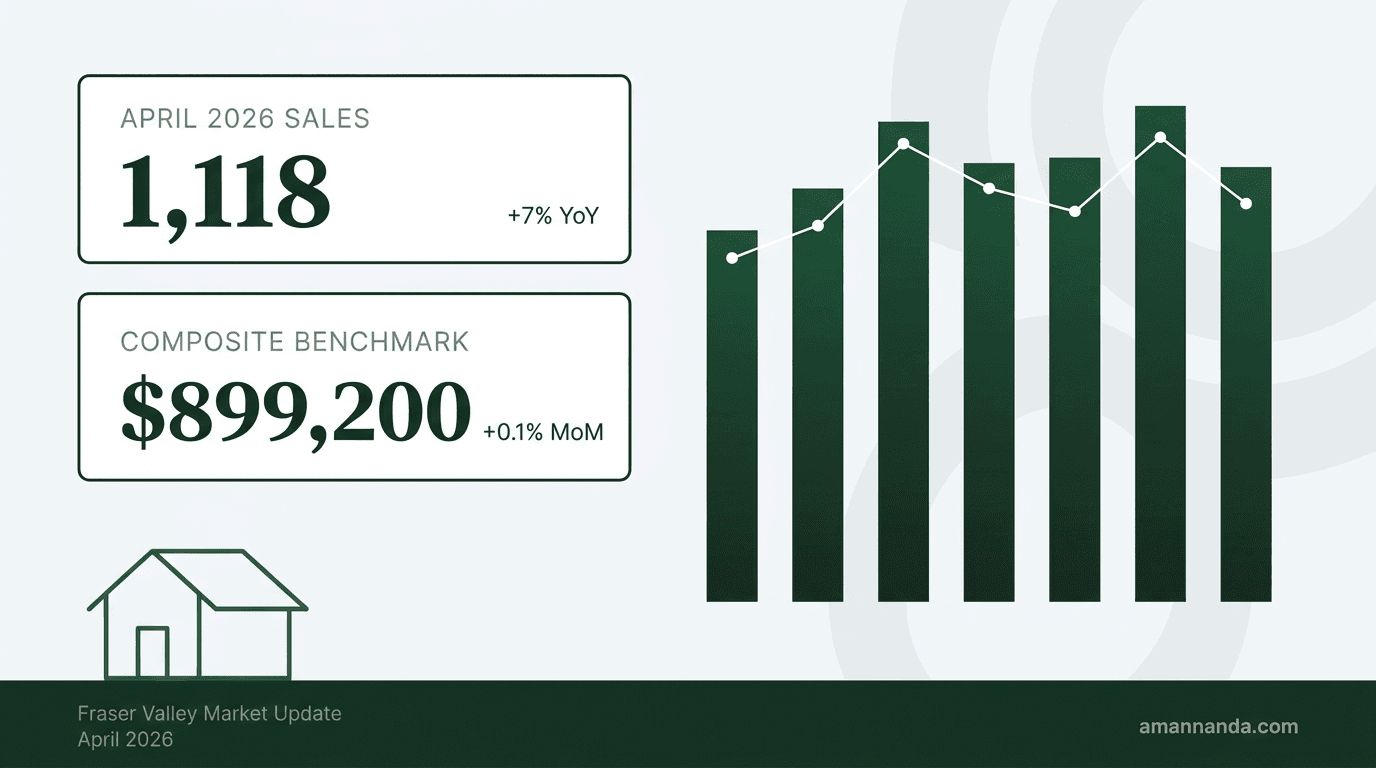
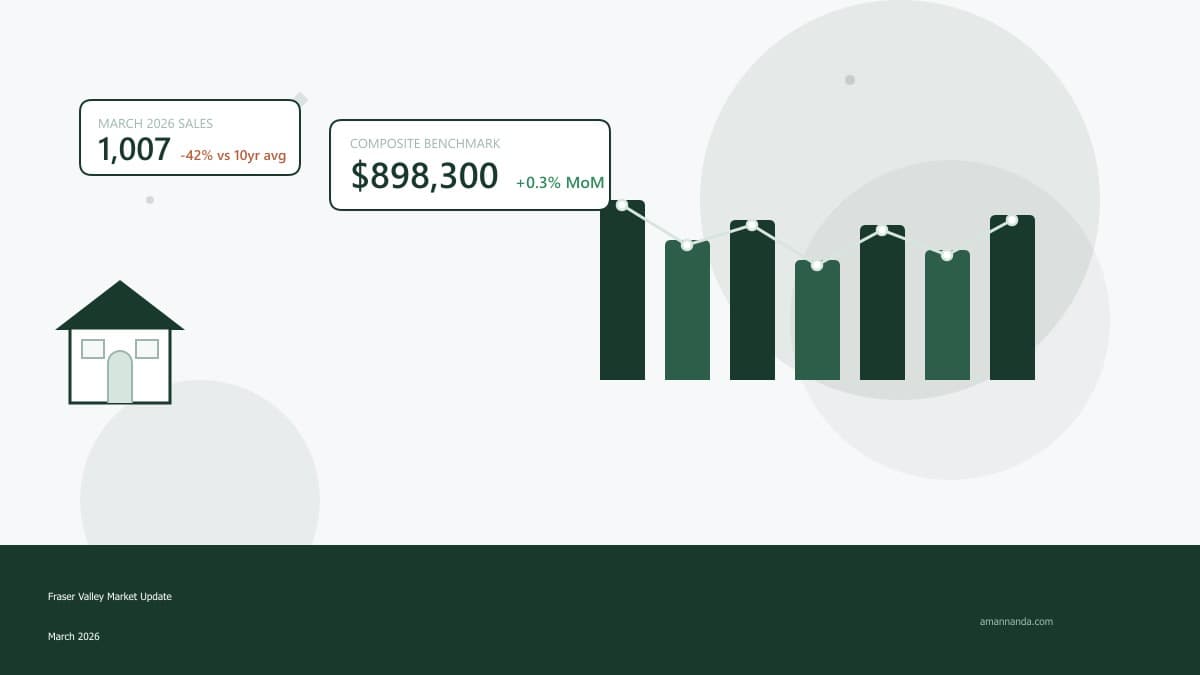
The Fraser Valley Real Estate Board recorded 1,118 sales in April 2026 — an 11% increase from March and 7% above April 2025. That's the first positive year-over-year sales reading in more than 12 months, and a meaningful signal that buyer activity is gradually returning.
New listings came in at 3,549, up 6% from March, as sellers continued to enter the spring market. Active listings climbed to 9,816 — up 7% month-over-month and a notable 45% above the 10-year seasonal average. Inventory is still elevated, which keeps buyers in the driver's seat.
Key Takeaway
| Metric | Apr 2026 | Mar 2026 | MoM Change | YoY Change |
|---|---|---|---|---|
| Total Sales | 1,118 | 1,007 | +11.0% | +7.0% |
| New Listings | 3,549 | 3,341 | +6.2% | — |
| Active Listings | 9,816 | 9,201 | +6.7% | +2.3% |
| Sales-to-Active Ratio | 11% | 11% | — | — |
Benchmark Prices — Second Straight Monthly Gain
The composite benchmark price for a typical Fraser Valley home came in at $899,200 in April — up 0.1% from March. That makes it the second consecutive month-over-month increase after 11 straight months of declines. Year-over-year, prices remain down across the board, but the bleeding has clearly slowed.
Here's how benchmark prices look across property types for the Fraser Valley board area:
| Property Type | Benchmark Price | MoM Change | YoY Change |
|---|---|---|---|
| Detached | $1,374,800 | -0.1% | -8.8% |
| Townhouse | $771,600 | -0.1% | -7.4% |
| Apartment | $491,000 | +0.4% | -8.3% |
| Composite (All Types) | $899,200 | +0.1% | — |
Apartments led the way in April with a +0.4% month-over-month gain — the strongest of the three segments. Detached and townhouse prices held essentially flat, with marginal -0.1% dips. The year-over-year picture is still in correction territory, but every property type saw its YoY decline shrink slightly compared to March.
Surrey Spotlight — The Sub-Area Breakdown
Surrey is by far the largest market in the Fraser Valley, and activity varies meaningfully between sub-areas. Here's how each Surrey sub-area performed in April, with all year-over-year comparisons against April 2025:
| Property Type | Sales | Active Listings | Benchmark | YoY |
|---|---|---|---|---|
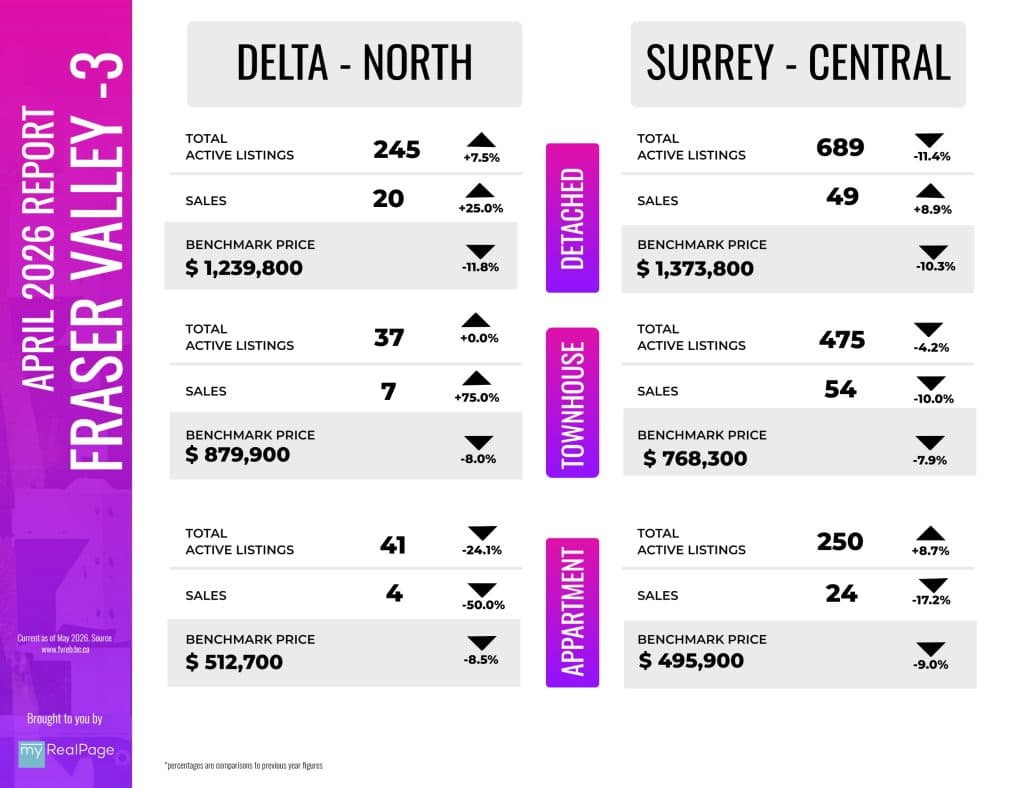
| Detached | 49 | 689 | $1,373,800 | -10.3% |
| Townhouse | 54 | 475 | $768,300 | -7.9% |
| Apartment | 24 | 250 | $495,900 | -9.0% |
| Property Type | Sales | Active Listings | Benchmark | YoY |
|---|---|---|---|---|
| Detached | 43 | 210 | $1,382,000 | -8.7% |
| Townhouse | 34 | 146 | $773,100 | -8.3% |
| Apartment | 16 | 74 | $538,700 | -7.7% |
| Property Type | Sales | Active Listings | Benchmark | YoY |
|---|---|---|---|---|
| Detached | 33 | 377 | $1,311,600 | -11.9% |
| Townhouse | 23 | 114 | $703,600 | -6.9% |
| Apartment | 64 | 652 | $423,100 | -10.9% |
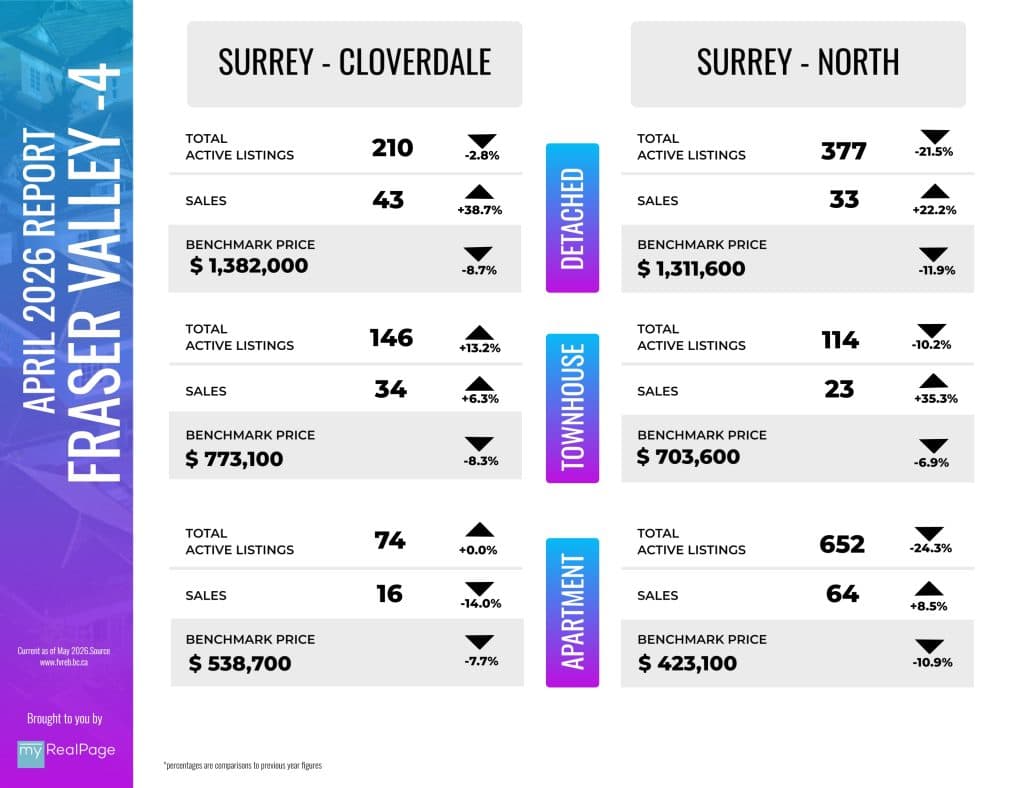
North Surrey continues to be the toughest sub-area — detached prices are down 11.9% year-over-year and apartments down 10.9%, with 652 active condo listings creating significant inventory pressure. Cloverdale is the relative bright spot among Surrey sub-areas, with the smallest YoY declines in detached (-8.7%) and a strong +38.7% year-over-year jump in detached sales (43 in April vs. 31 a year ago).
Central Surrey saw detached sales rise +8.9% year-over-year, with active listings down 11.4% — a tightening dynamic that may start putting upward pressure on prices in the second half of the year if it holds.
How Long Homes Are Taking to Sell
Days on market improved across every property type in April as spring buyer activity picked up:
| Property Type | Avg. Days to Sell |
|---|---|
| Detached | 37 days |
| Townhouse | 32 days |
| Apartment | 42 days |
Compared to March (39, 36, and 43 days respectively), every property type is moving faster. Townhouses continue to be the quickest sellers at just over 4.5 weeks. Detached homes shaved off another two days from March. Apartments still take the longest to move — reflecting the elevated inventory in the condo segment — but even there, things are tightening.
Across the Fraser Valley
Here's a snapshot of detached benchmark prices by community across the Fraser Valley, with year-over-year comparisons against April 2025:
| Area | Sales | Active Listings | Detached Benchmark | YoY |
|---|---|---|---|---|
| Central Surrey | 49 | 689 | $1,373,800 | -10.3% |
| Cloverdale | 43 | 210 | $1,382,000 | -8.7% |
| North Surrey | 33 | 377 | $1,311,600 | -11.9% |
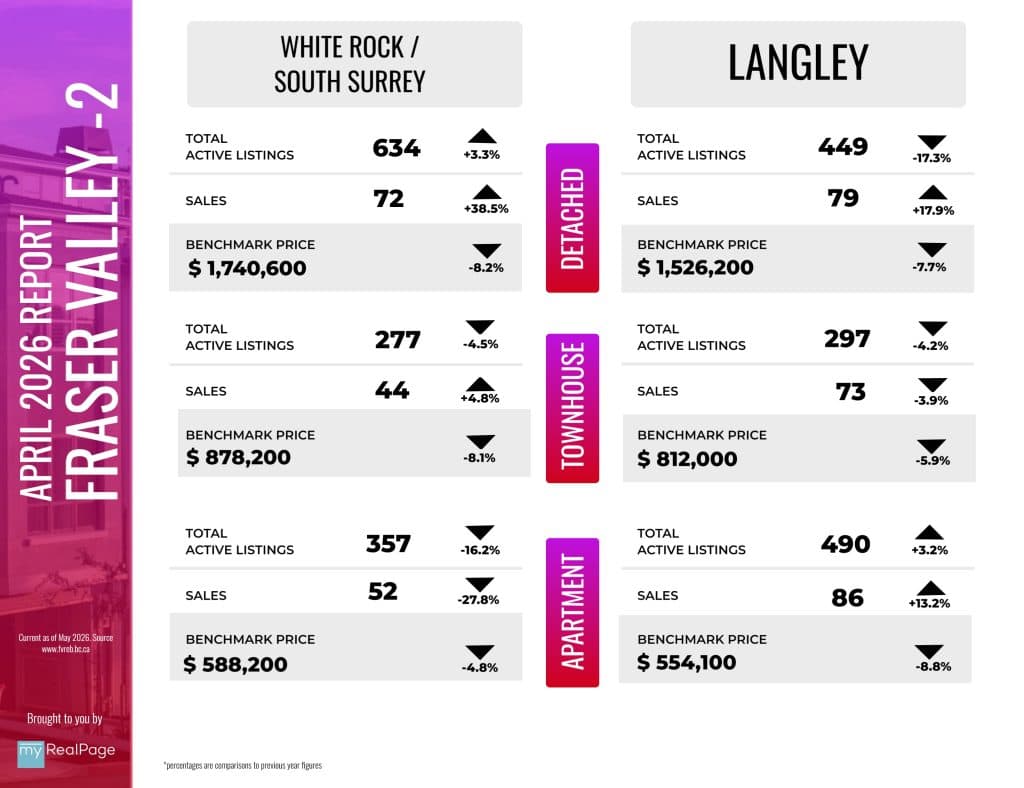
| White Rock / South Surrey | 72 | 634 | $1,740,600 | -8.2% |
| Langley | 79 | 449 | $1,526,200 | -7.7% |
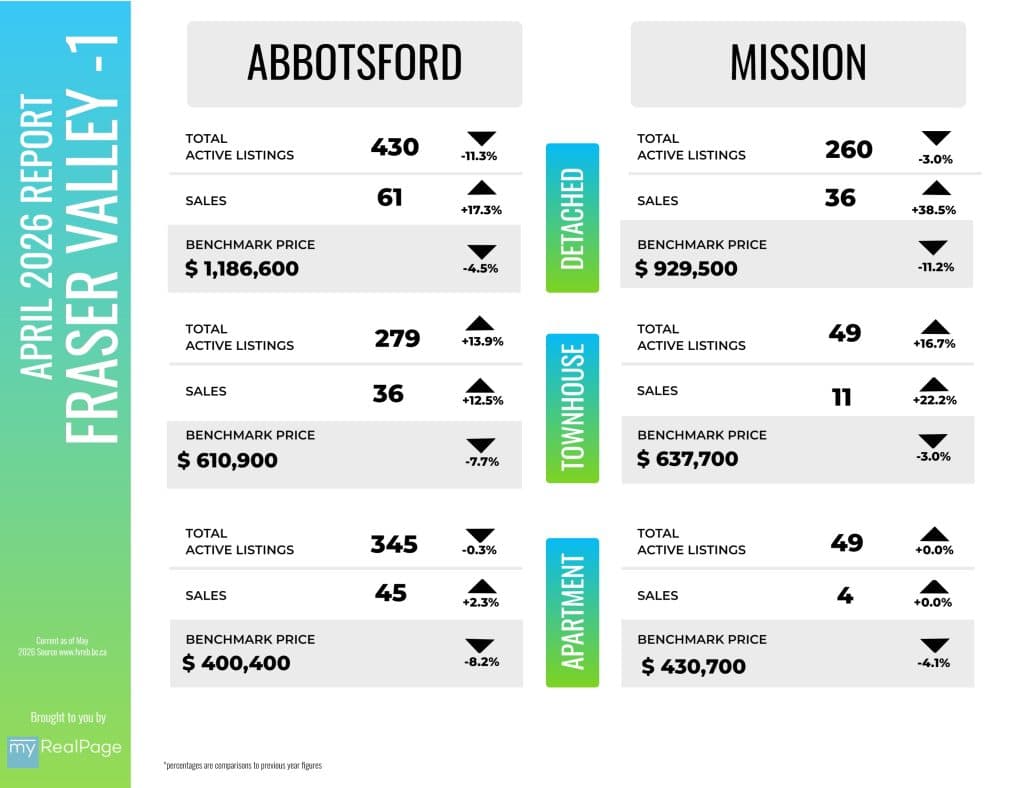
| Abbotsford | 61 | 430 | $1,186,600 | -4.5% |
| Mission | 36 | 260 | $929,500 | -11.2% |
| North Delta | 20 | 245 | $1,239,800 | -11.8% |
Abbotsford detached posted the smallest year-over-year decline in the valley at just -4.5%, with sales up +17.3% year-over-year. White Rock and South Surrey detached saw a striking +38.5% year-over-year jump in sales (72 vs. 52 a year ago), suggesting the upper-end market is genuinely re-engaging. North Delta and Mission remain the steepest decliners on price, both down roughly 11% year-over-year.
What This Means for Buyers and Sellers
If You're Buying
The buyer's market window is still open — but it's narrower than it was a month ago. Inventory is elevated, prices are 7–9% lower than a year ago, and sellers are still negotiating. That said, sales are now growing year-over-year for the first time since early 2025, and the price floor that started forming in March appears to be holding.
If you've been on the sidelines waiting for the absolute bottom, the signals suggest we're likely past it. Apartments and higher-end detached in South Surrey/White Rock are already showing strong year-over-year sales growth. Acting strategically in the next few months — before momentum builds further — could mean meaningfully better terms than you'll get in late summer or fall.
If You're Selling
Two consecutive months of benchmark gains and a year-over-year sales increase are genuinely positive signs — but the market is still favouring buyers. With active listings 45% above the 10-year average and the sales-to-active ratio still at 11%, well-priced homes are selling faster than they were in February or March, but overpriced listings continue to sit.
Pricing strategy matters more than ever right now. The homes moving fastest are the ones that come to market priced right out of the gate, with strong photography and proper exposure. Stretching for an aspirational number is the most common reason listings stall in this market.
✅ Bottom Line
Looking Ahead — What to Expect in May
As spring activity continues to build, the question is whether sales can keep outpacing inventory growth. If they do, the sales-to-active ratio will start climbing toward balanced territory — and we'll likely see broader price firmness across all segments, not just apartments and higher-end detached.
As FVREB CEO Baldev Gill noted, "current conditions are creating a more favourable buying environment than we've seen in recent years." Improving affordability, stabilizing prices, and favourable borrowing costs continue to give buyers an unusual amount of leverage — but the window is narrowing as activity picks up.
The May numbers will be posted here next month. If you have questions about what's happening in your specific neighbourhood or want to understand what these numbers mean for your situation, don't hesitate to reach out.
Have Questions About the Market?
Whether you're thinking about buying, selling, or just want to understand what's happening in Surrey real estate — I'm here to help.