After nearly a year of steady price declines, the Fraser Valley housing market is showing its first real signs of stabilizing. Benchmark prices edged up month-over-month for the first time in 11 months — a notable shift. But sales activity remains well below normal, and inventory continues to climb.
Here's the full breakdown of what happened in March, what the numbers mean, and where things stand for buyers and sellers in Surrey and across the Fraser Valley.
The Big Picture
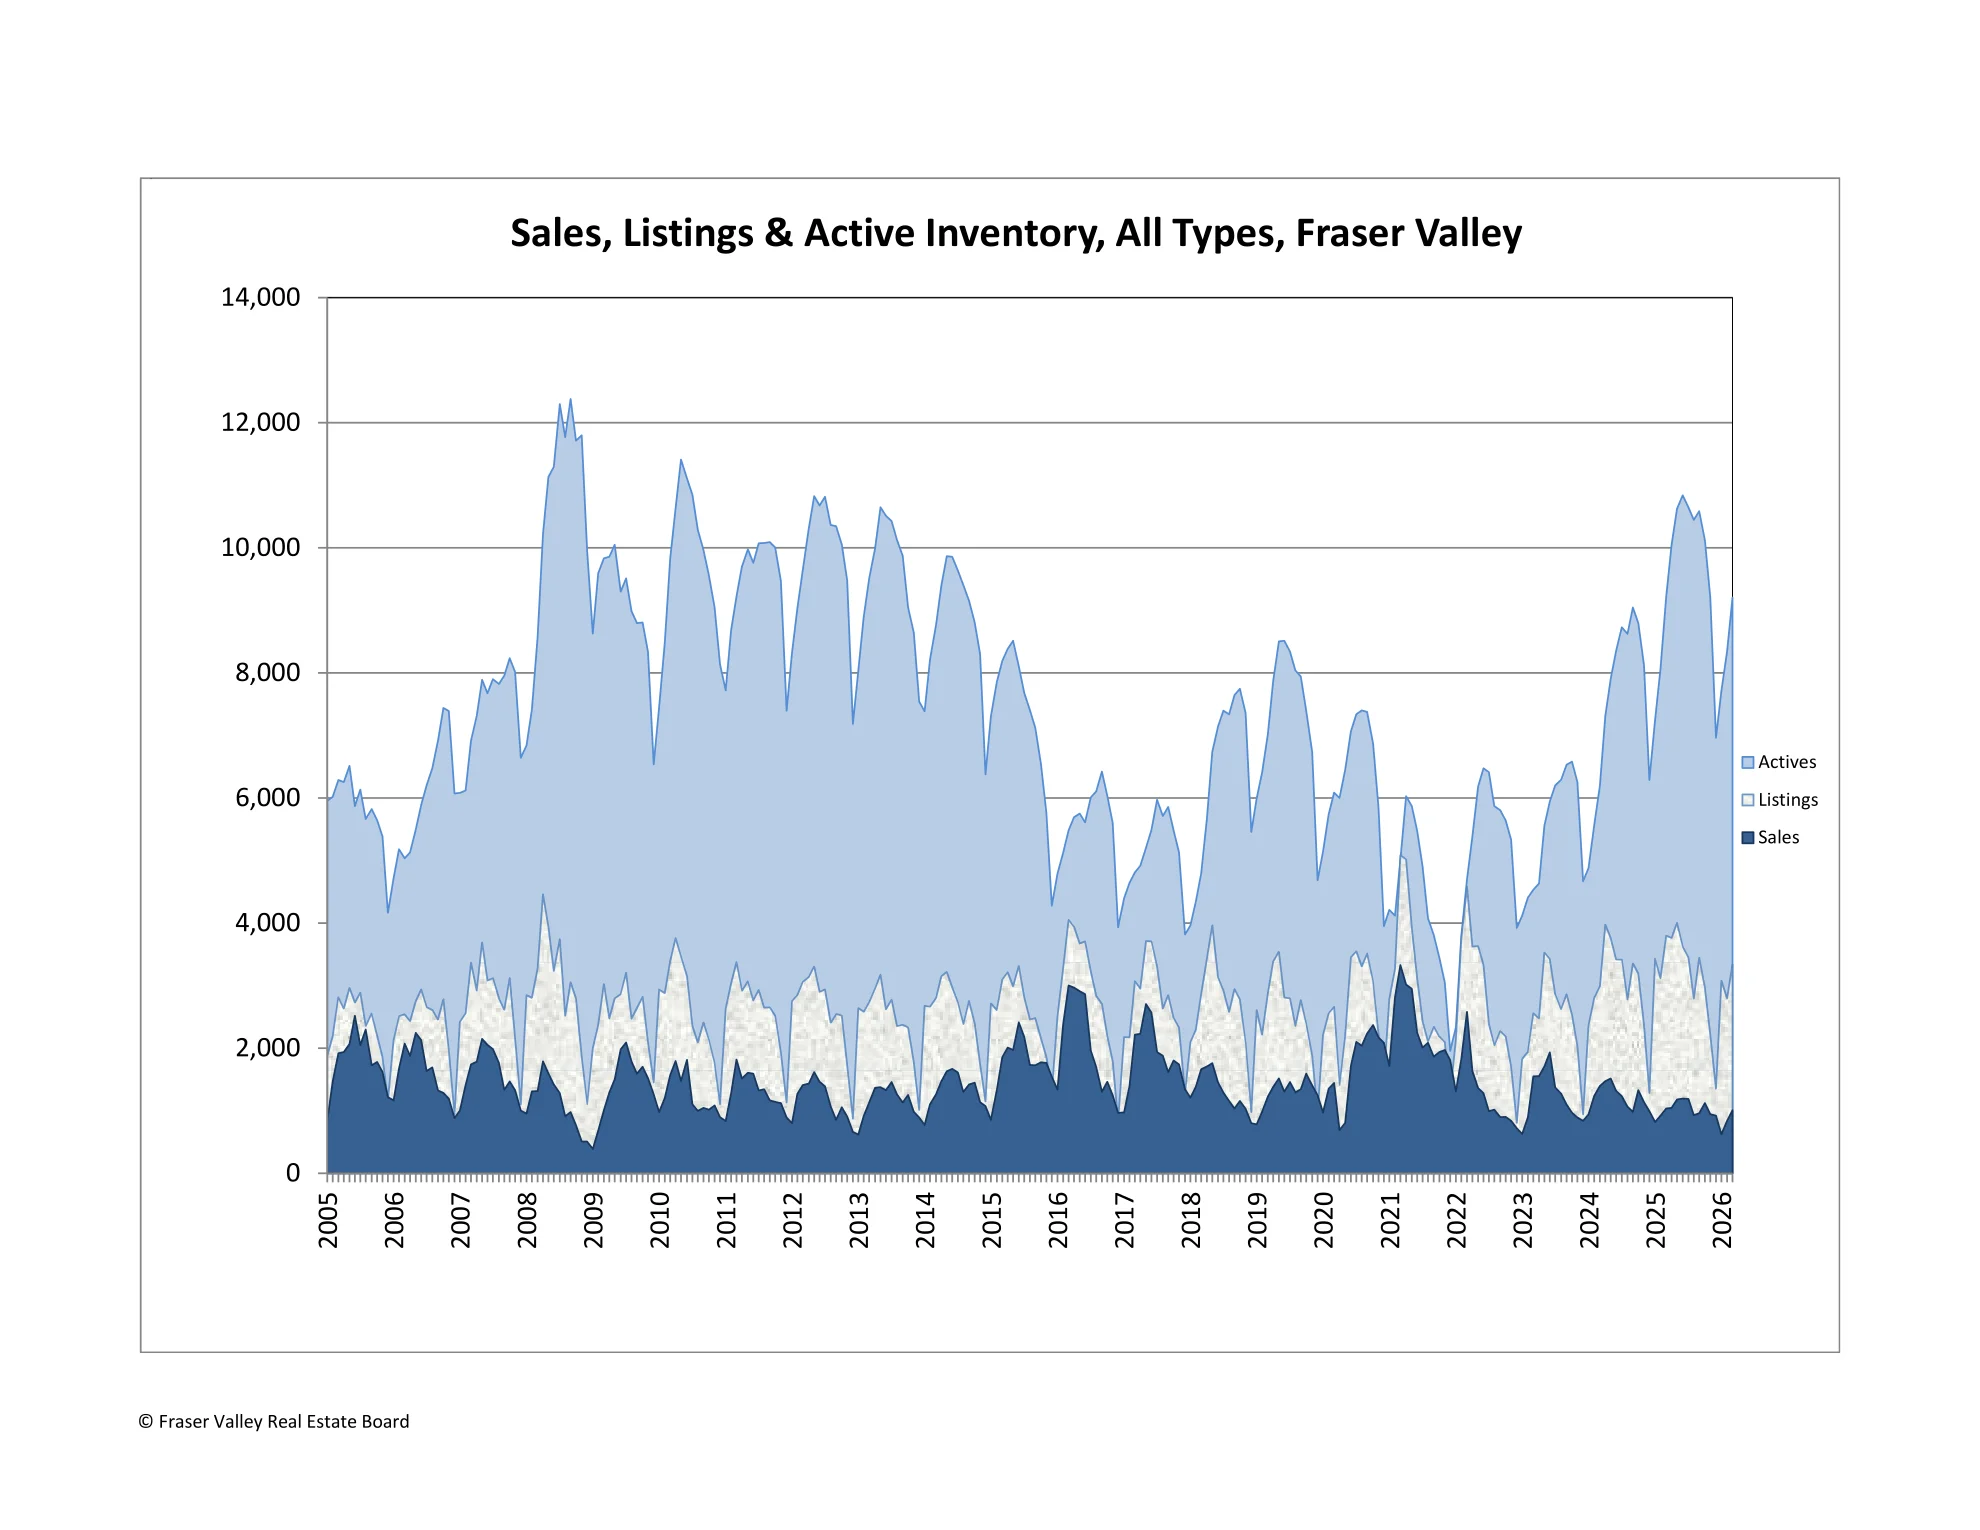
The Fraser Valley Real Estate Board recorded 1,007 sales in March 2026 — a 20% increase from February, but still 3% below March 2025 and a significant 42% below the ten-year seasonal average. Spring activity is picking up, but the market is far from firing on all cylinders.
New listings came in at 3,341, up 20% from February, as sellers look to get ahead of the spring market. Active listings climbed to 9,201 — up 10% month-over-month and 50% above the 10-year seasonal average. That's a lot of choice for buyers.
Key Takeaway
| Metric | Mar 2026 | Feb 2026 | MoM Change | Mar 2025 | YoY Change |
|---|---|---|---|---|---|
| Total Sales | 1,007 | 843 | +19.5% | 1,036 | -2.8% |
| New Listings | 3,341 | 2,796 | +19.5% | 3,800 | -12.1% |
| Active Listings | 9,201 | 8,344 | +10.3% | 9,219 | -0.2% |
| Average Price | $962,167 | $913,110 | +5.4% | $1,028,301 | -6.4% |
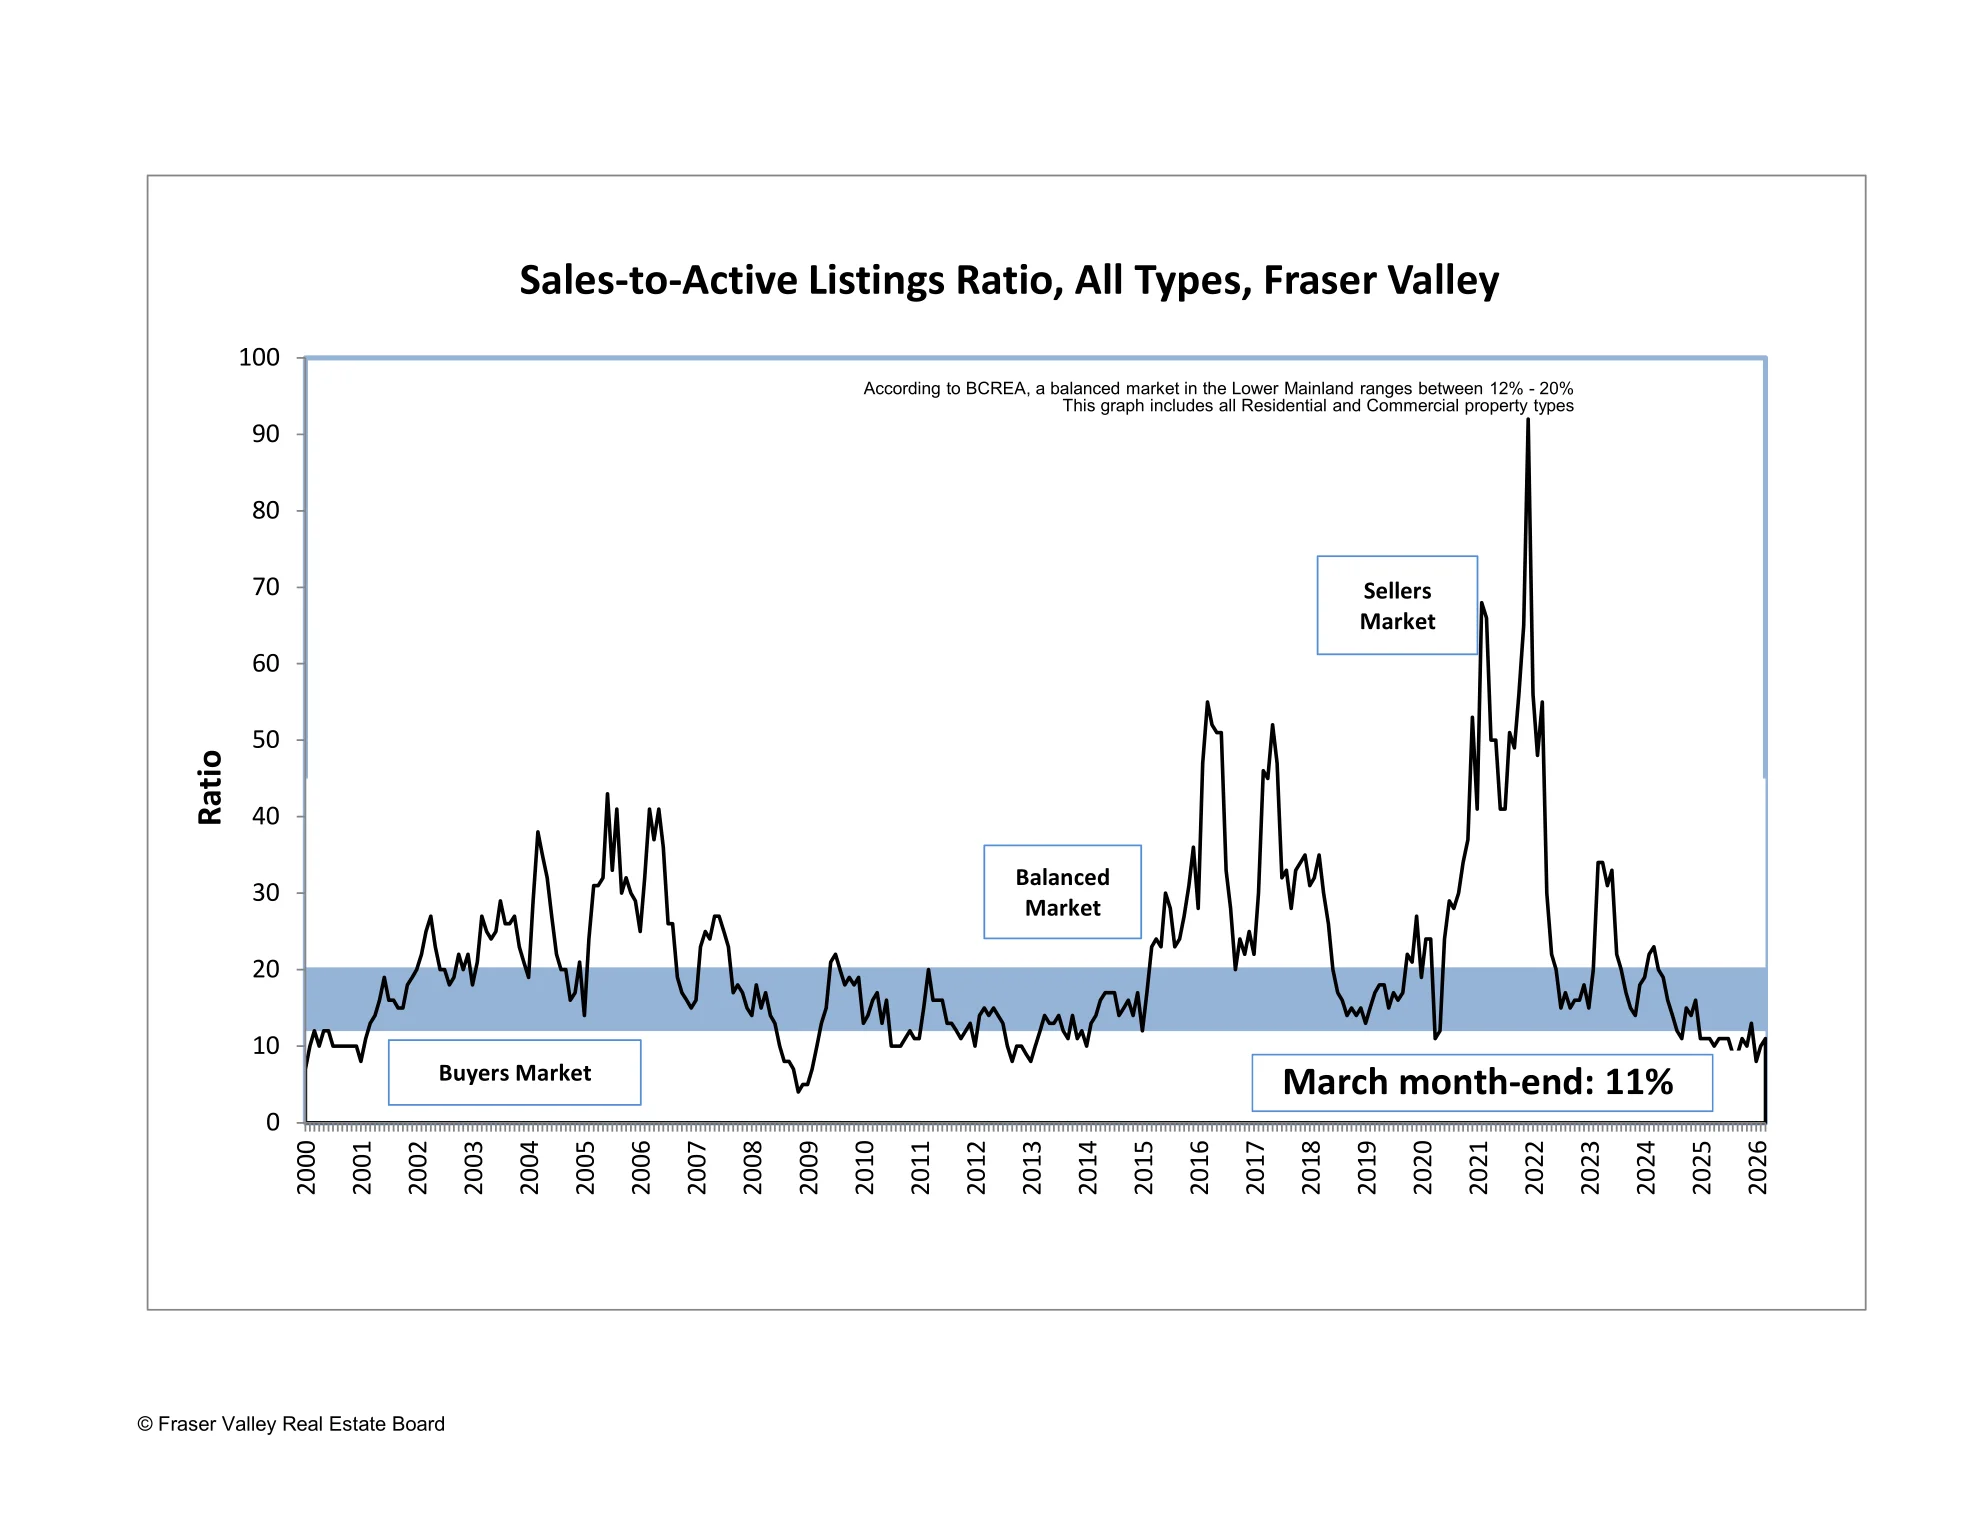
| Sales-to-Active Ratio | 11% | 10% | — | 11% | — |
Benchmark Prices — First Signs of Stabilization
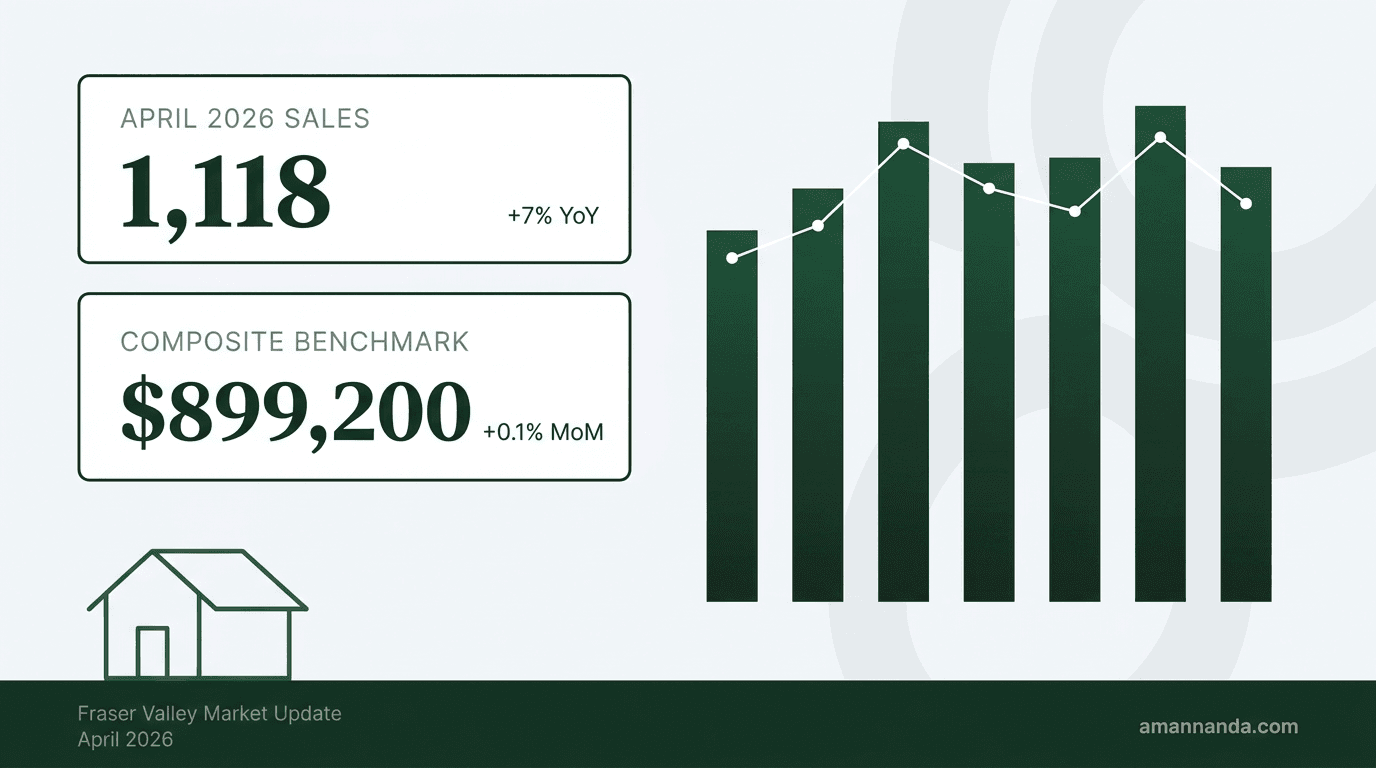
The composite benchmark price for a typical Fraser Valley home came in at $898,300 in March — up 0.3% from February. That's the first month-over-month increase in 11 months. Year-over-year, prices are still down 7.7%, but the bleeding appears to be slowing.
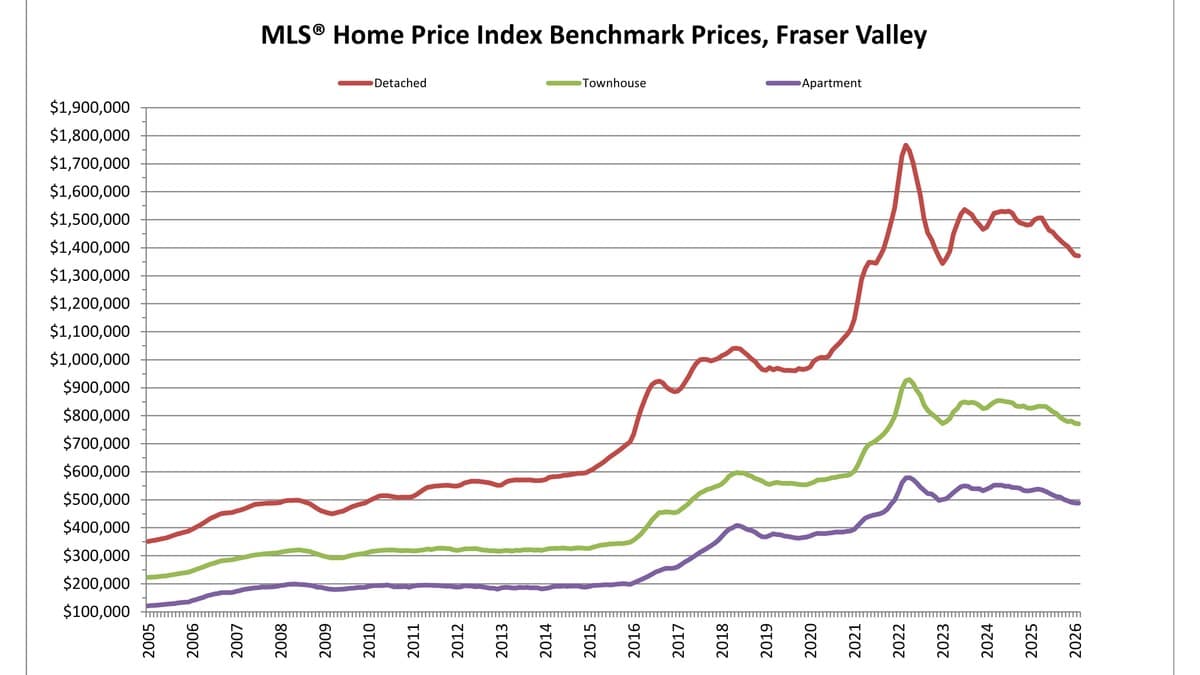
Here's how benchmark prices look across property types for the Fraser Valley board area:
| Property Type | Benchmark Price | MoM Change | YoY Change |
|---|---|---|---|
| Detached | $1,375,600 | +0.3% | -8.7% |
| Townhouse | $772,700 | +0.3% | -7.3% |
| Apartment | $489,200 | +0.2% | -9.2% |
| Composite (All Types) | $898,300 | +0.3% | -7.7% |
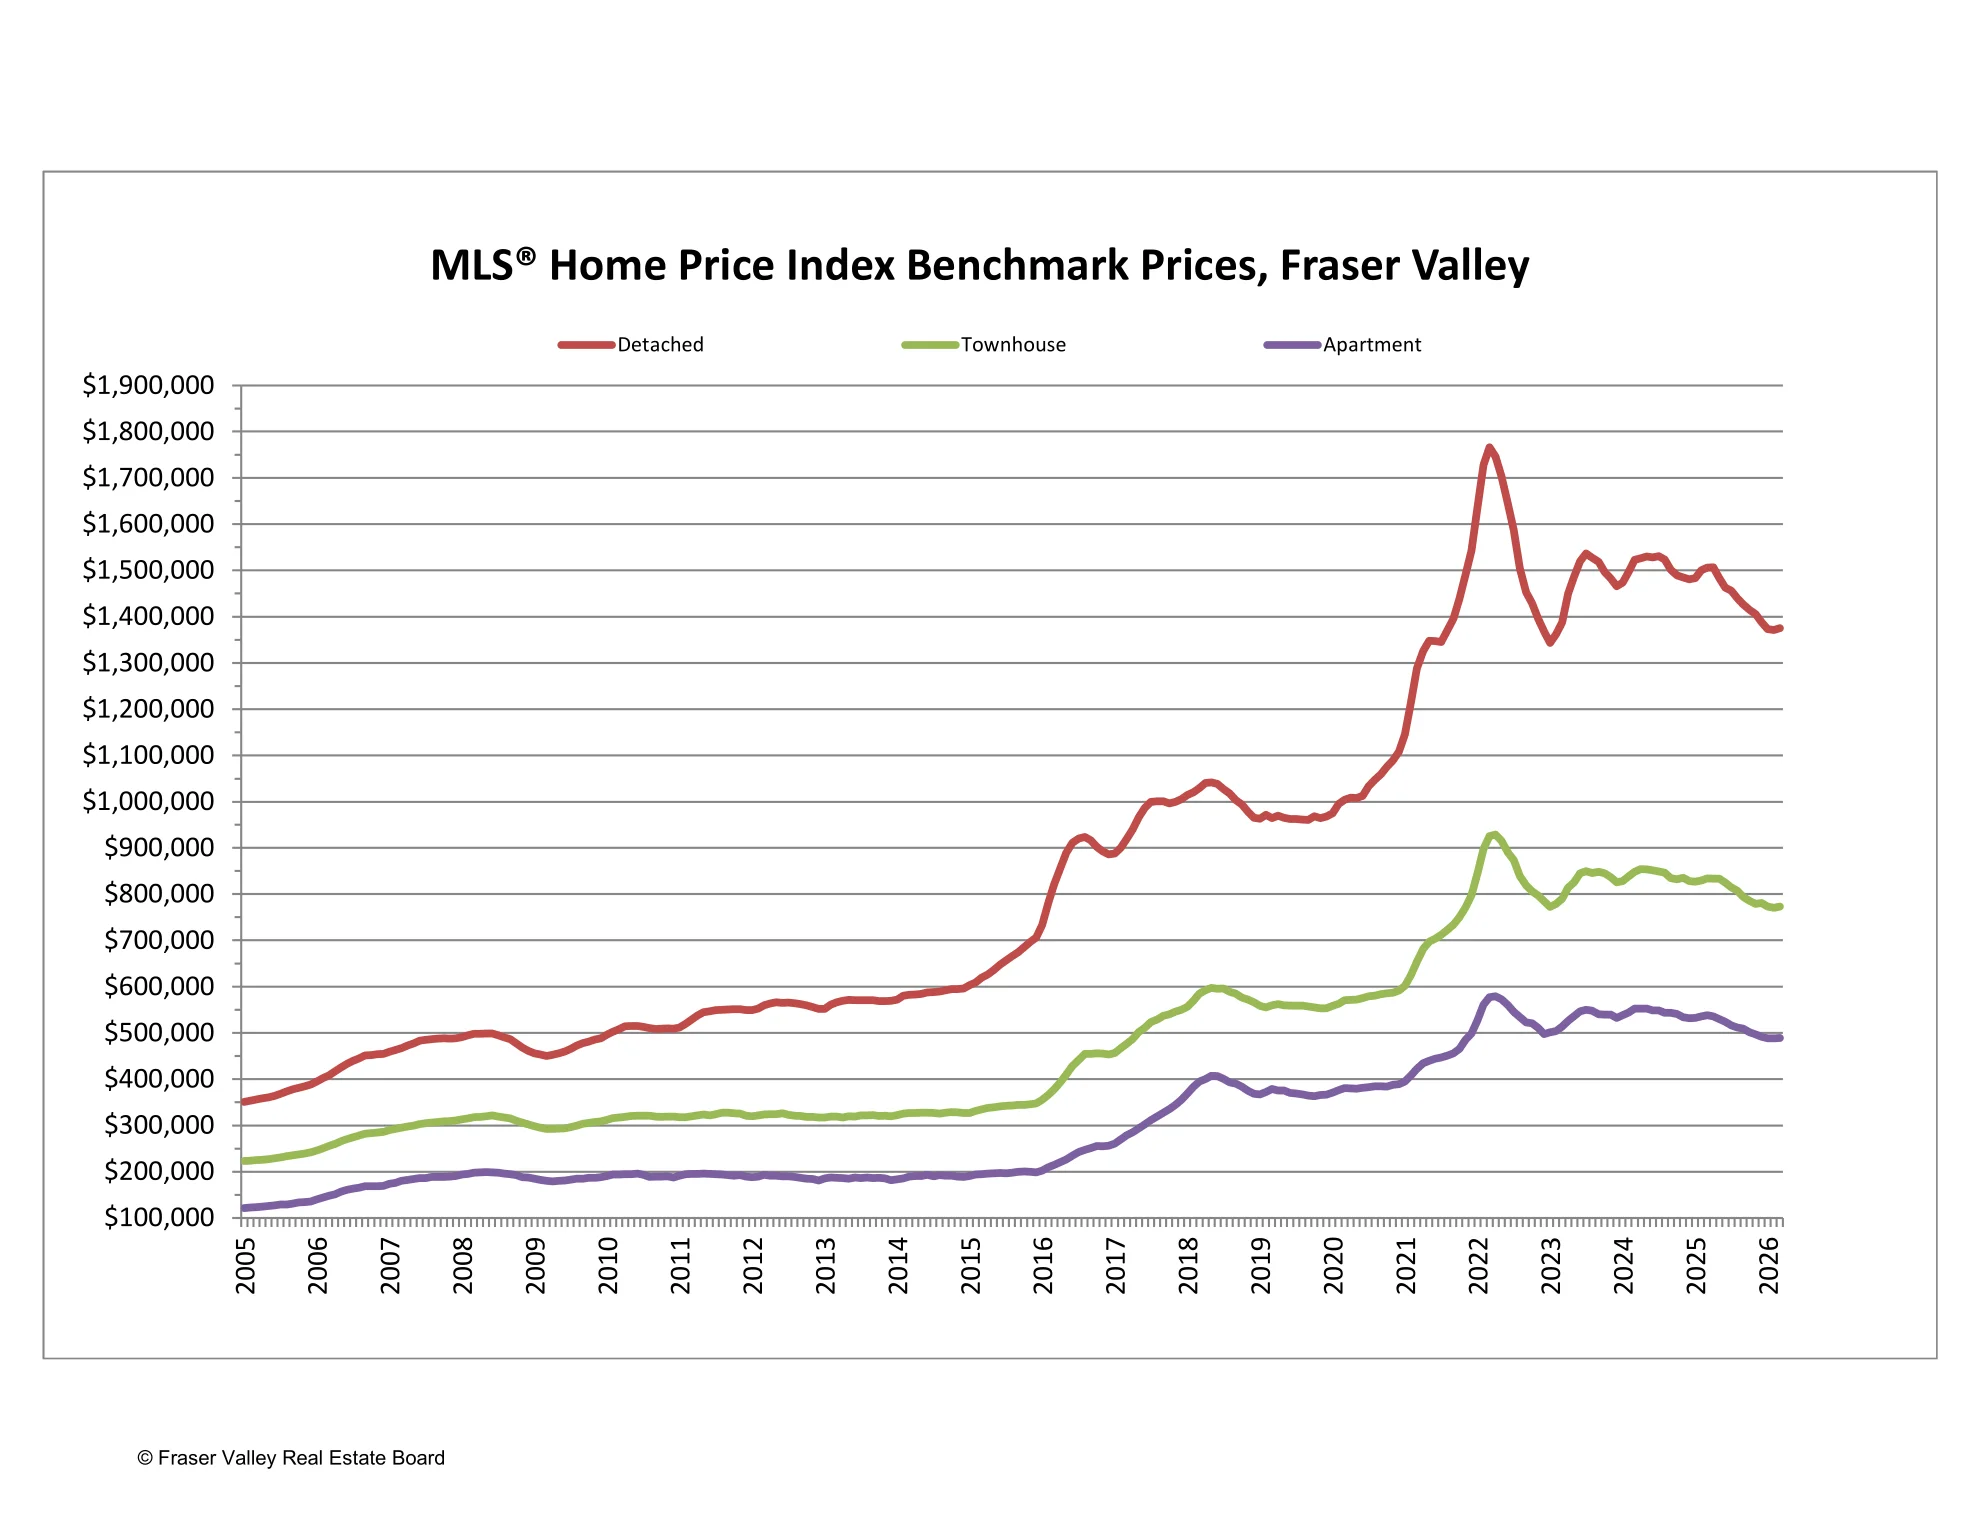
All three property types saw small month-over-month increases for the first time since early 2025. Apartments continue to show the steepest year-over-year decline at -9.2%, but the month-over-month bump suggests we may be near a floor in some segments.
Surrey Spotlight — The Local Numbers
Surrey remains the largest city in the Fraser Valley and where most of the local activity happens. The City of Surrey (combining North Surrey, Central Surrey, Cloverdale, and South Surrey excluding White Rock) saw:
| Property Type | Sales | Benchmark Price | MoM Change | YoY Change |
|---|---|---|---|---|
| Detached | 152 | $1,463,500 | +0.2% | -10.2% |
| Townhouse | 137 | $792,700 | +0.4% | -8.0% |
| Apartment | 121 | $477,100 | -0.4% | -9.3% |
Detached and townhouse prices in Surrey saw small month-over-month gains, consistent with the broader stabilization trend. Surrey apartments bucked the trend slightly, dipping 0.4% — North Surrey condos in particular continue to face pressure with a 10.9% year-over-year decline.
By Surrey Sub-Area
| Sub-Area | Detached Benchmark | MoM | YoY |
|---|---|---|---|
| Central Surrey | $1,371,400 | -0.1% | -10.7% |
| Cloverdale | $1,391,000 | +3.3% | -7.9% |
| North Surrey | $1,344,000 | -0.3% | -10.9% |
| South Surrey / White Rock | $1,718,500 | -0.2% | -9.2% |
Cloverdale stands out this month with a notable 3.3% month-over-month bounce in detached prices. Central Surrey and North Surrey remain the hardest-hit sub-areas year-over-year, both down over 10%. South Surrey and White Rock saw a steeper annual decline than last month, now down 9.2%.
How Long Homes Are Taking to Sell
Days on market improved across the board in March as spring activity picked up:
| Property Type | Avg. Days to Sell |
|---|---|
| Detached | 39 days |
| Townhouse | 36 days |
| Apartment | 43 days |
Compared to February (47, 39, and 45 days respectively), every property type is selling faster. Townhouses continue to move the quickest at just over 5 weeks. Detached homes saw the biggest improvement, dropping from 47 to 39 days. Apartments are still the slowest to move, reflecting the oversupply in that segment, especially in North Surrey.
Across the Fraser Valley
Here's a snapshot of composite benchmark prices by community across the Fraser Valley:
| Area | Benchmark Price | MoM | YoY |
|---|---|---|---|
| Fraser Valley Board (All) | $898,300 | +0.3% | -7.7% |
| Surrey | $945,500 | +0.1% | -8.9% |
| Langley | $965,600 | +0.2% | -7.0% |
| South Surrey & White Rock | $1,045,700 | +0.4% | -8.2% |
| North Delta | $1,080,300 | -1.2% | -8.9% |
| Abbotsford | $747,200 | +0.9% | -5.8% |
| Mission | $847,700 | +0.4% | -9.3% |
Most areas saw month-over-month gains, led by Abbotsford at +0.9%. North Delta was the notable exception, dropping 1.2% month-over-month and down nearly 9% year-over-year. Mission remains one of the steepest annual decliners at -9.3%, though it did edge up slightly from February.
What This Means for Buyers and Sellers
If You're Buying
This is still one of the strongest buyer's markets in years. Inventory is elevated, prices are 7–9% lower than a year ago, and sellers are willing to negotiate. The first signs of price stabilization don't change the fundamental dynamic — buyers have choice and leverage.
That said, the price floor may be forming. If you've been waiting for the absolute bottom, the data suggests we're close. With improving affordability and meaningful incentives in the condo segment especially, this could be a strategic time to move — before the market shifts and competition returns.
If You're Selling
The small uptick in benchmark prices is encouraging, but sellers shouldn't get ahead of themselves. With active listings 50% above the 10-year average and sales still well below normal, realistic pricing remains critical. Homes that are priced right are selling faster than last month — but overpriced listings are still sitting.
The spring market is underway. If your home is show-ready and priced competitively, this is a good window. But don't count on multiple offers or bidding wars — those days are not back yet.
✅ Bottom Line
Looking Ahead — What to Expect in April
As we move into the heart of spring, expect more listings and continued gradual improvement in sales activity. The big question is whether the price stabilization holds. If inventory keeps growing faster than demand, prices could soften again.
Economic uncertainty — tariff concerns, rising day-to-day costs, and global trade tensions — continues to weigh on buyer confidence. Many households are understandably cautious. But as FVREB CEO Baldev Gill noted, improving affordability and the potential for upward pressure on rates may make this a timely moment for buyers ready to act.
The April numbers will be posted here next month. If you have questions about what's happening in your specific neighbourhood or want to understand what these numbers mean for your situation, don't hesitate to reach out.
Have Questions About the Market?
Whether you're thinking about buying, selling, or just want to understand what's happening in Surrey real estate — I'm here to help.