February was an interesting month for the Fraser Valley. Sales picked up from a slow January — which is typical — but they're still well below where you'd normally expect for this time of year. Meanwhile, inventory keeps building, and prices continue to soften across the board.
Here's a breakdown of what happened, what the numbers actually mean, and what it looks like on the ground for buyers and sellers in Surrey and the Fraser Valley.
The Big Picture
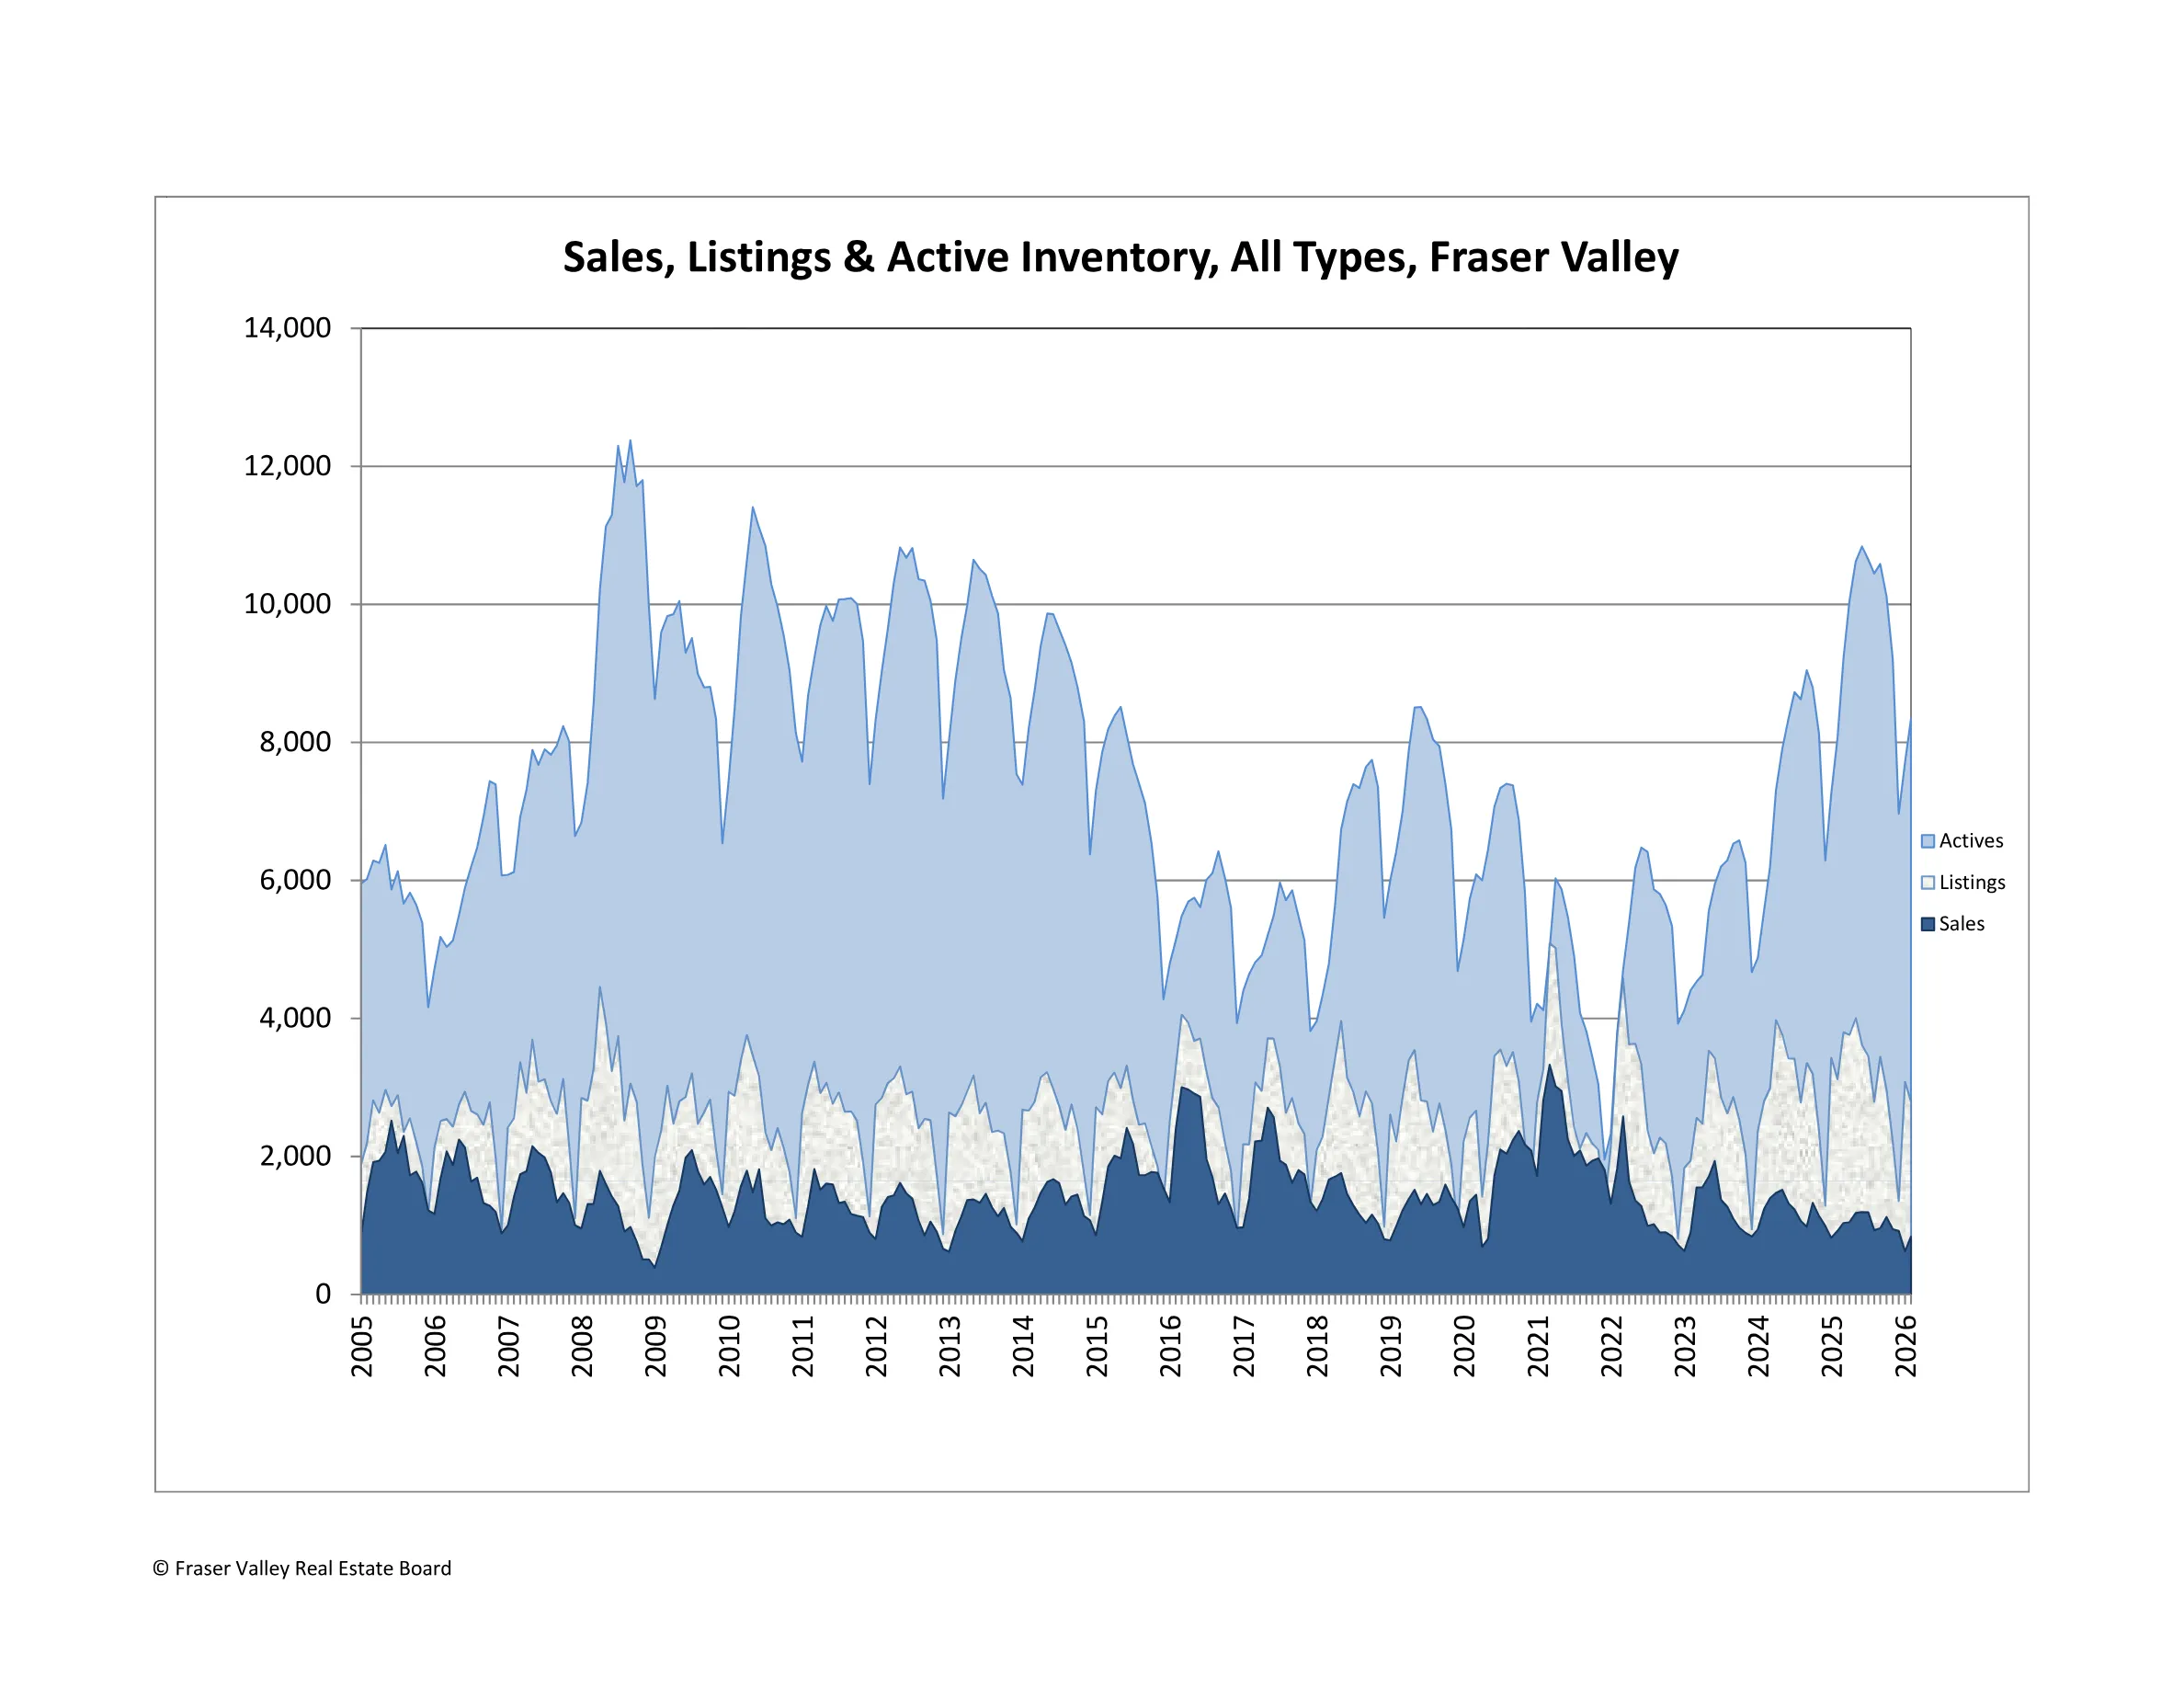
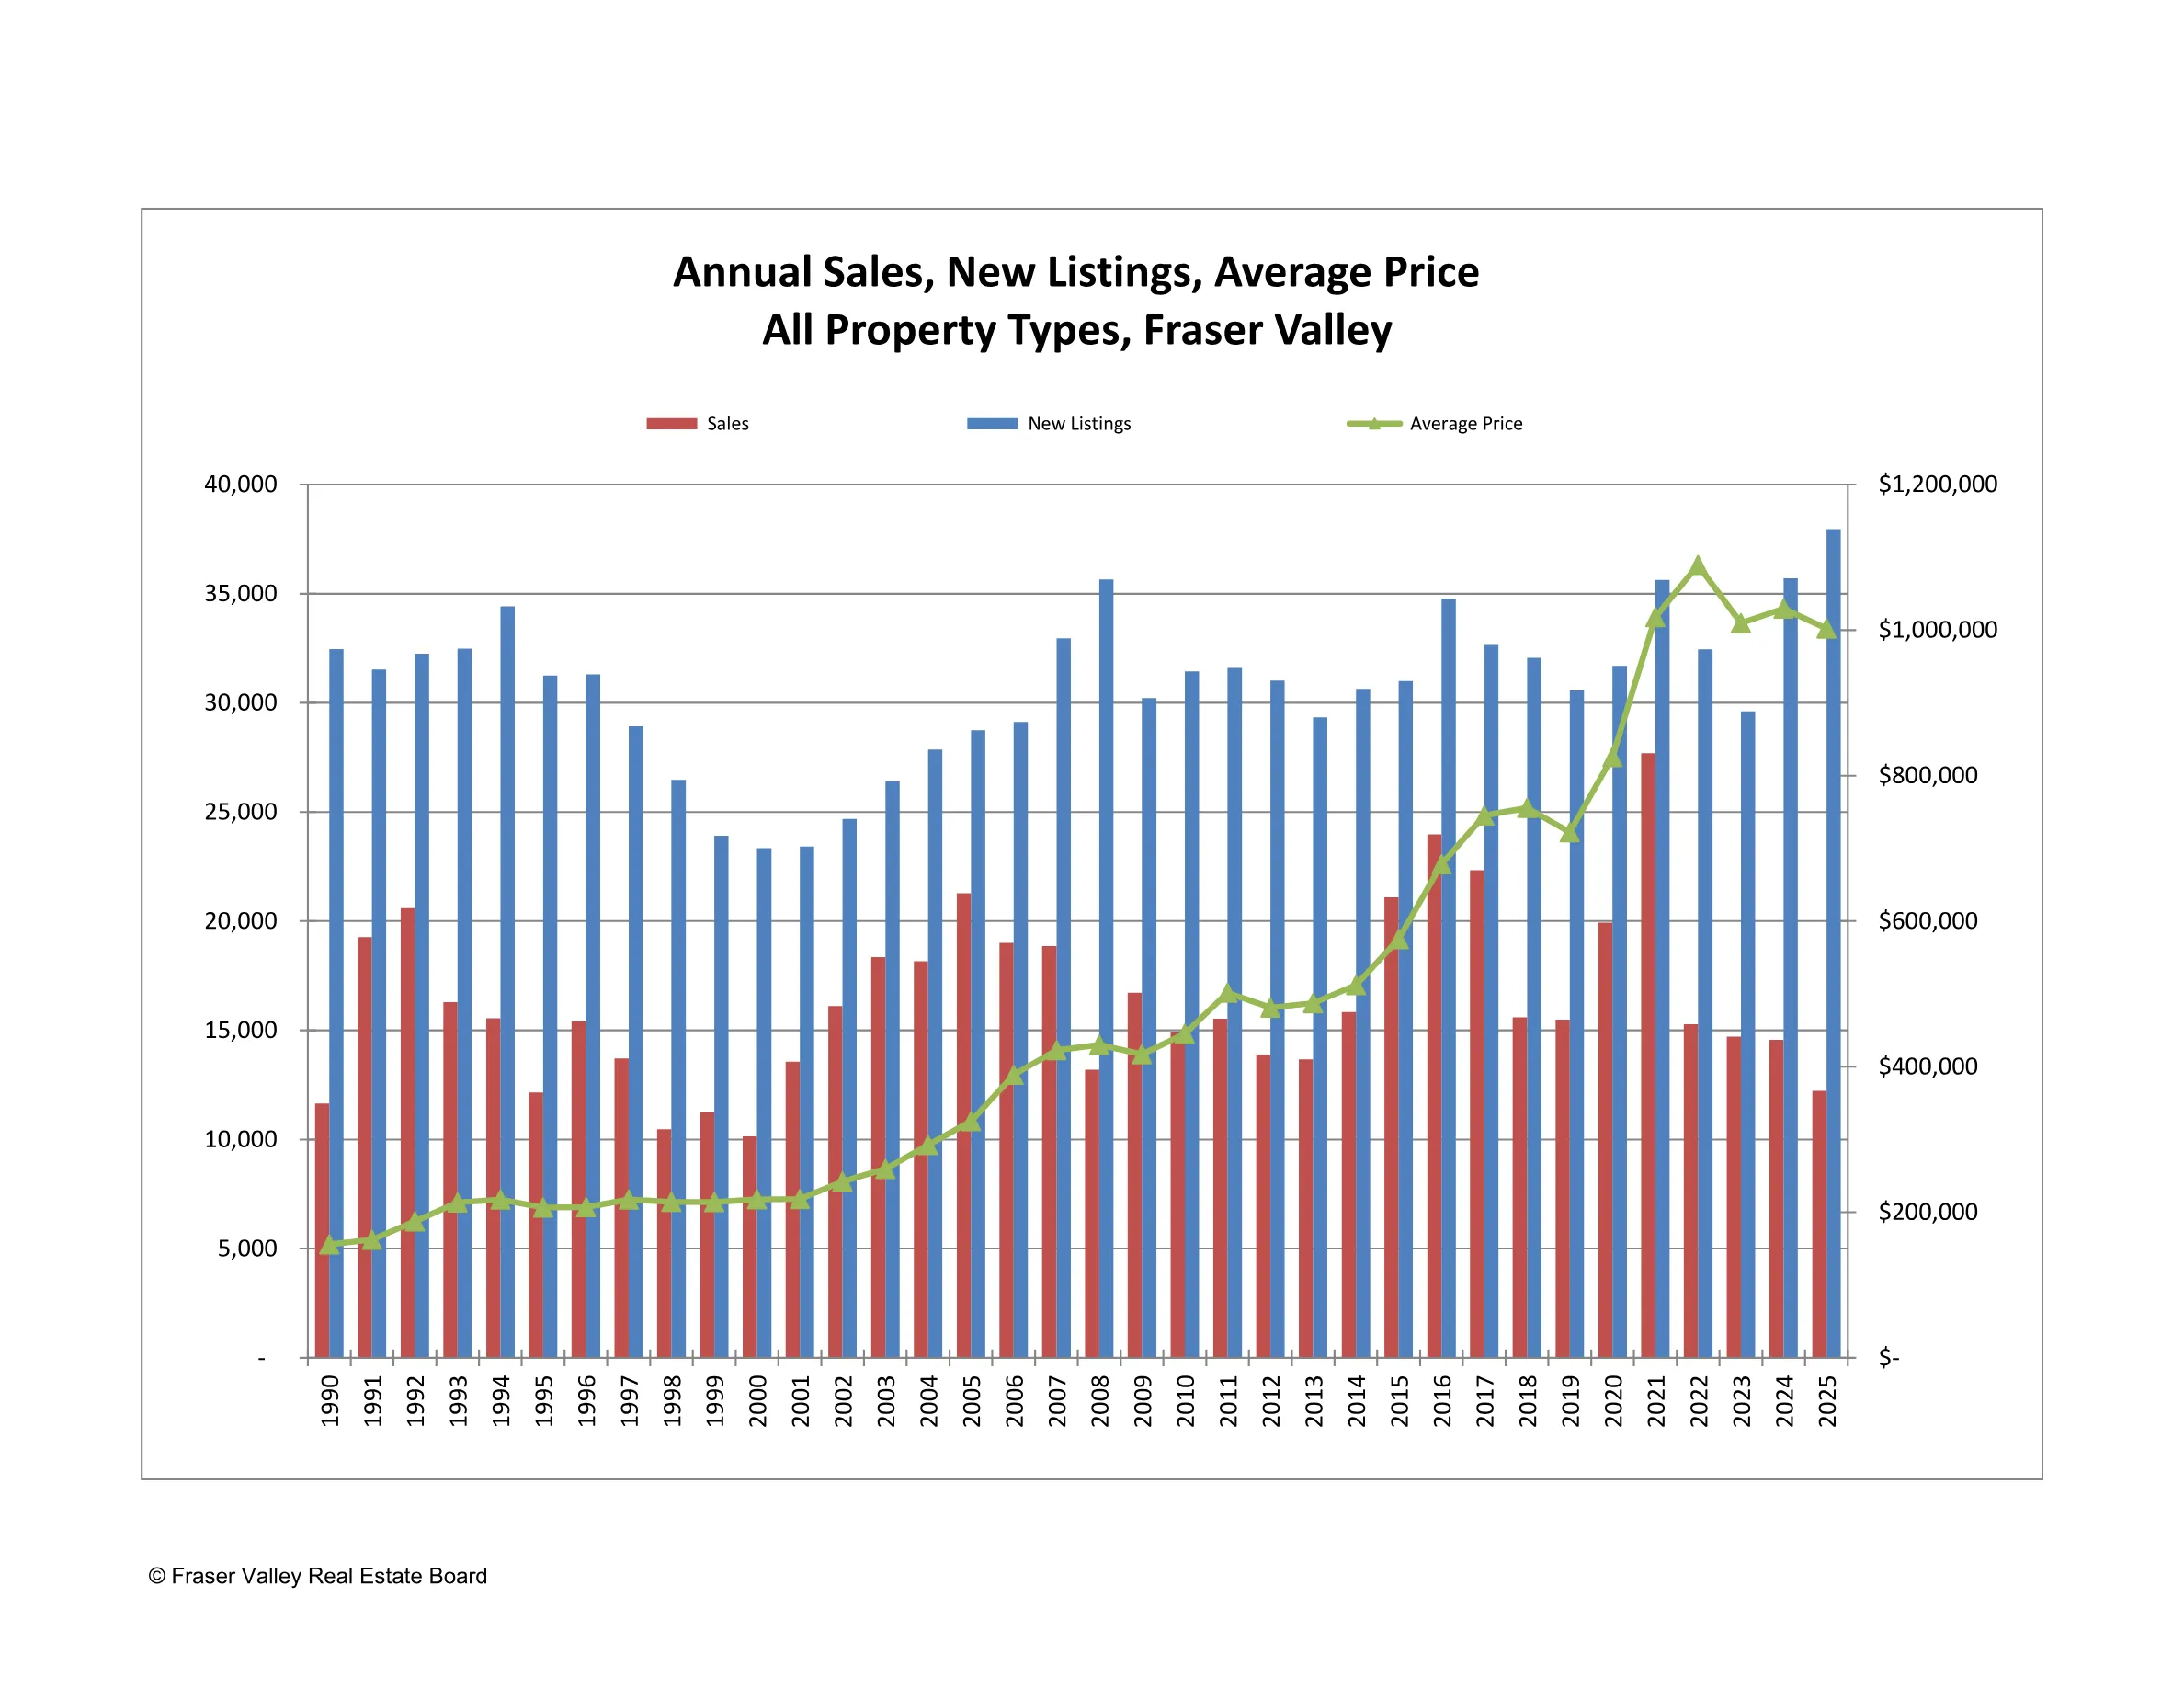
The Fraser Valley Real Estate Board recorded 843 sales in February 2026 — a 36% increase from January, but still 38% below the ten-year seasonal average. That tells you everything: yes, activity picked up, but the market is nowhere near normal levels.
New listings came in at 2,796, down 9% from January. Some sellers are holding off, likely waiting for the peak of spring to list. Active listings climbed to 8,344 — up 8% month-over-month and 51% above the 10-year average. That's a lot of inventory sitting on the market.
Key Takeaway
| Metric | Feb 2026 | Jan 2026 | MoM Change | Feb 2025 | YoY Change |
|---|---|---|---|---|---|
| Total Sales | 843 | 619 | +36.2% | 920 | -8.4% |
| New Listings | 2,796 | 3,078 | -9.2% | 3,121 | -10.4% |
| Active Listings | 8,344 | 7,711 | +8.2% | 8,070 | +3.4% |
| Average Price | $913,110 | $942,330 | -3.1% | $993,560 | -8.1% |
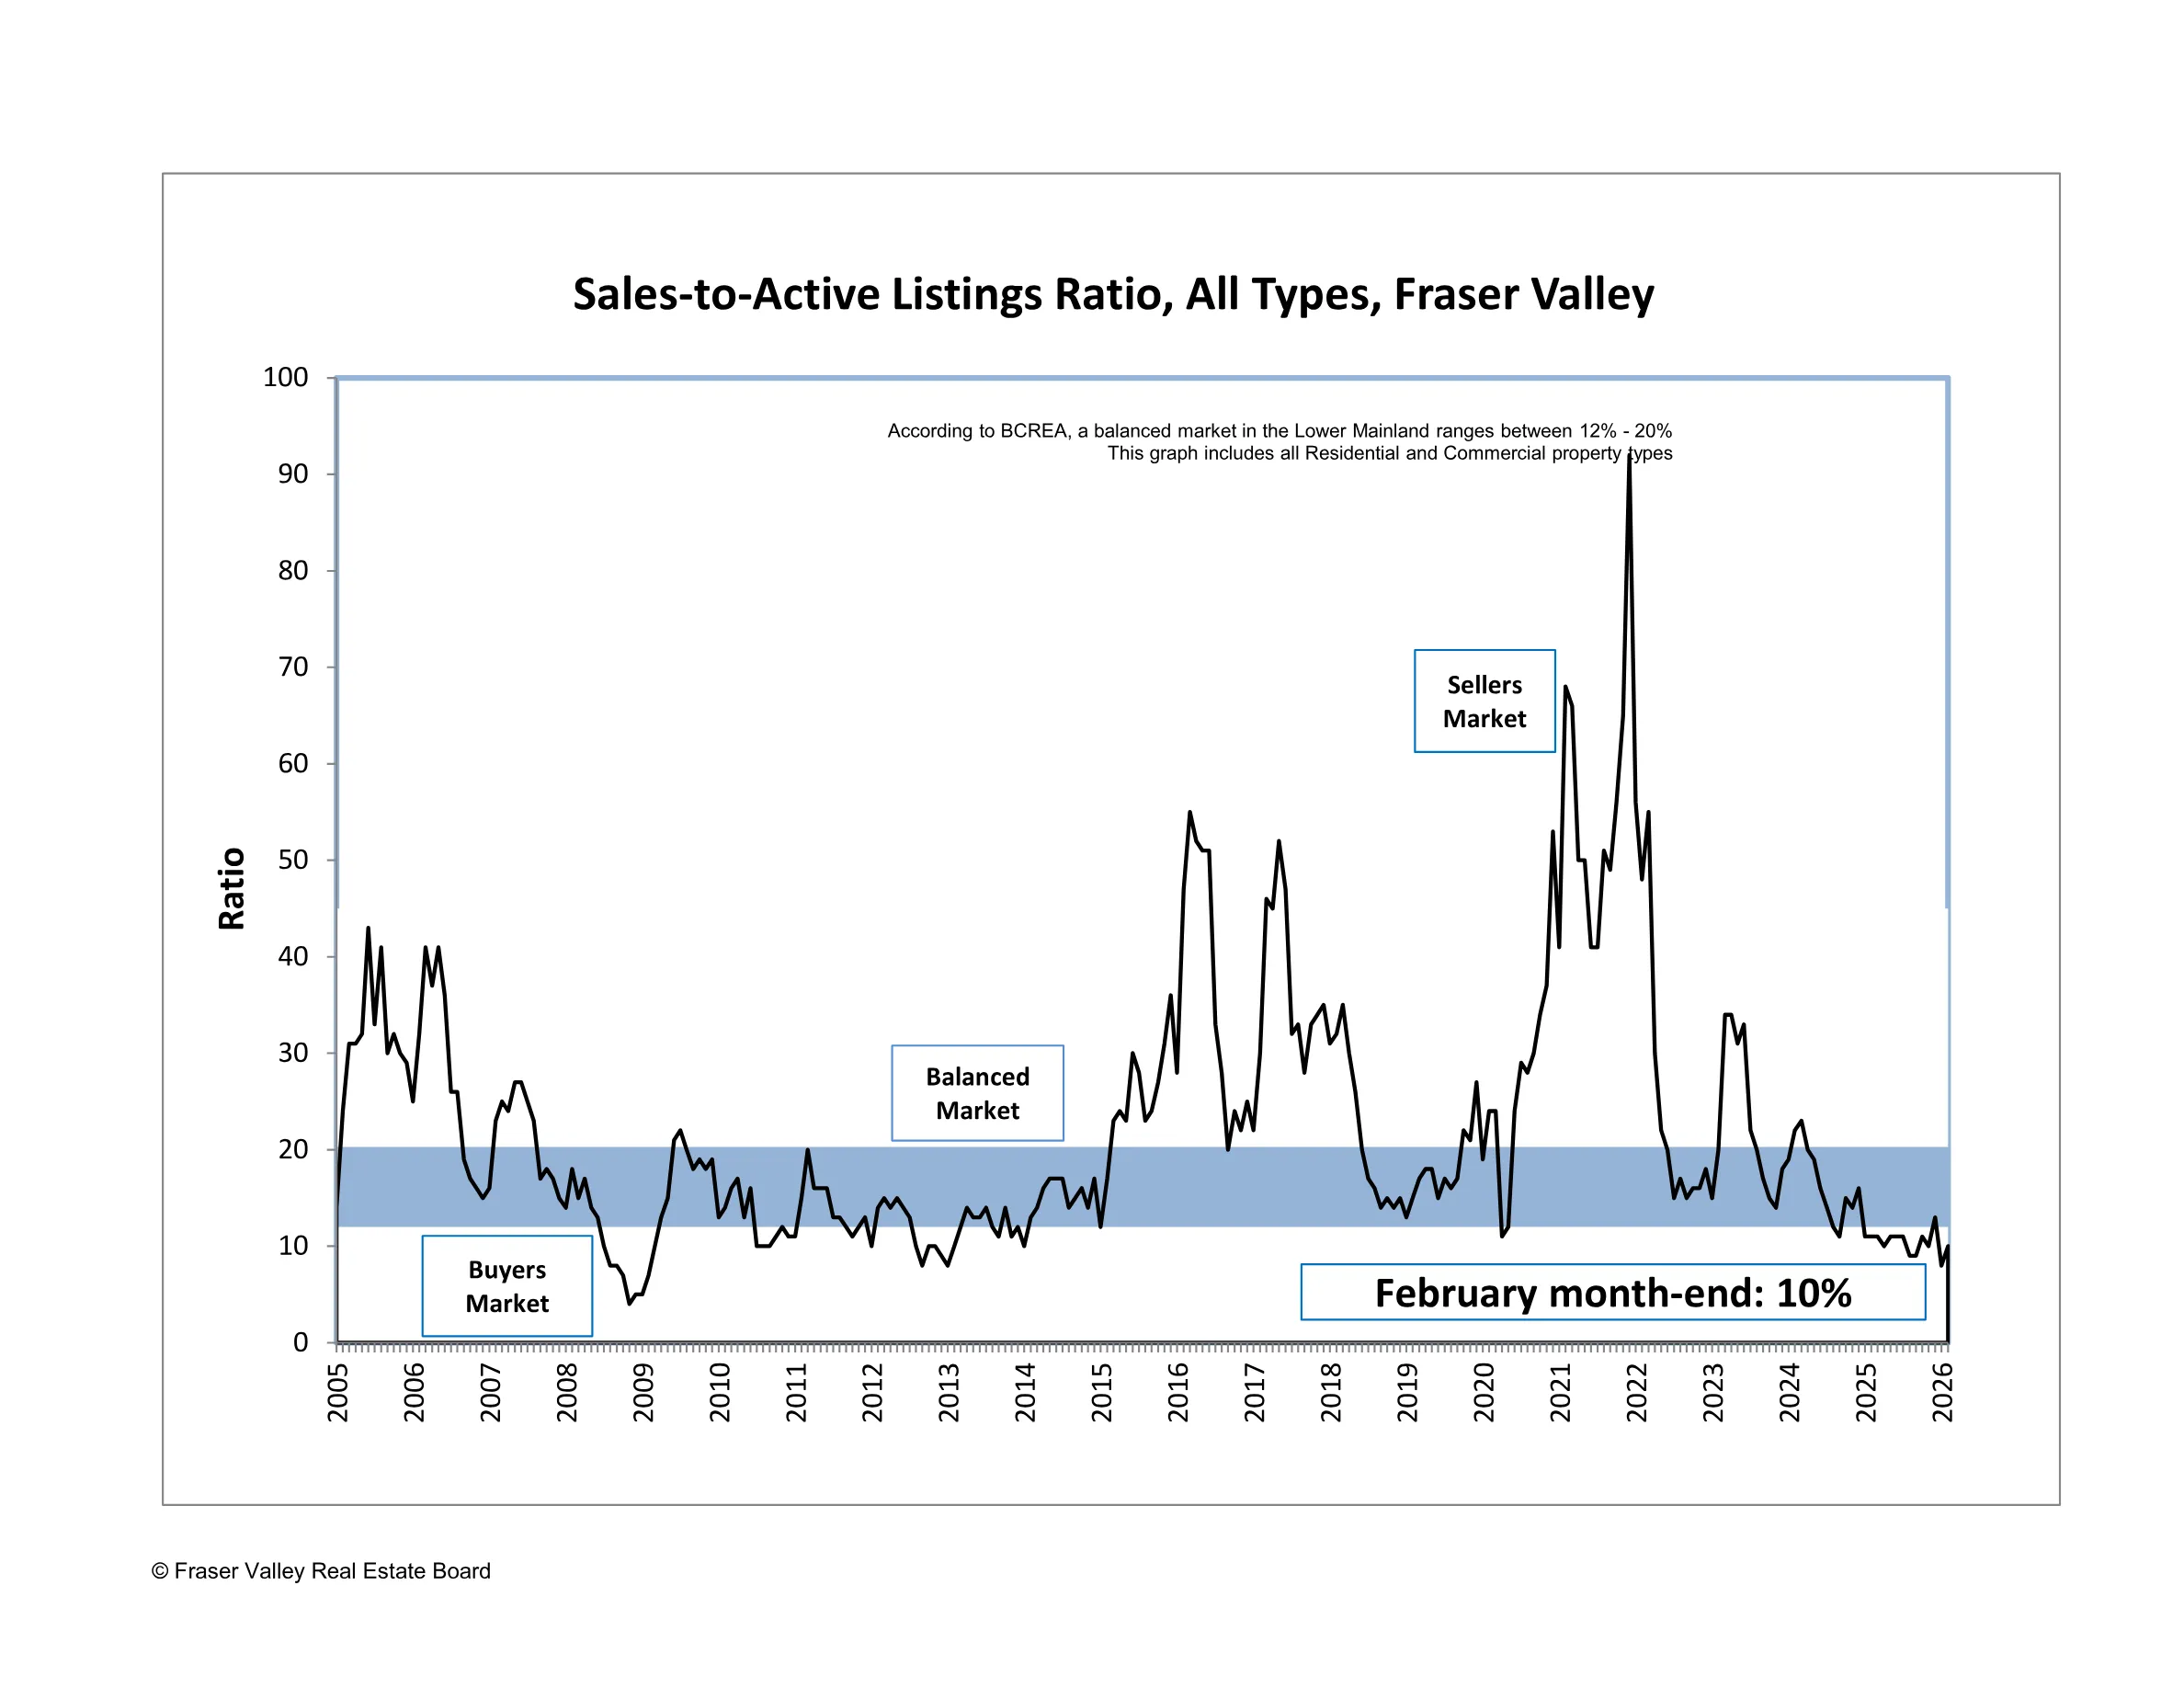
| Sales-to-Active Ratio | 10% | 8% | — | 11% | — |
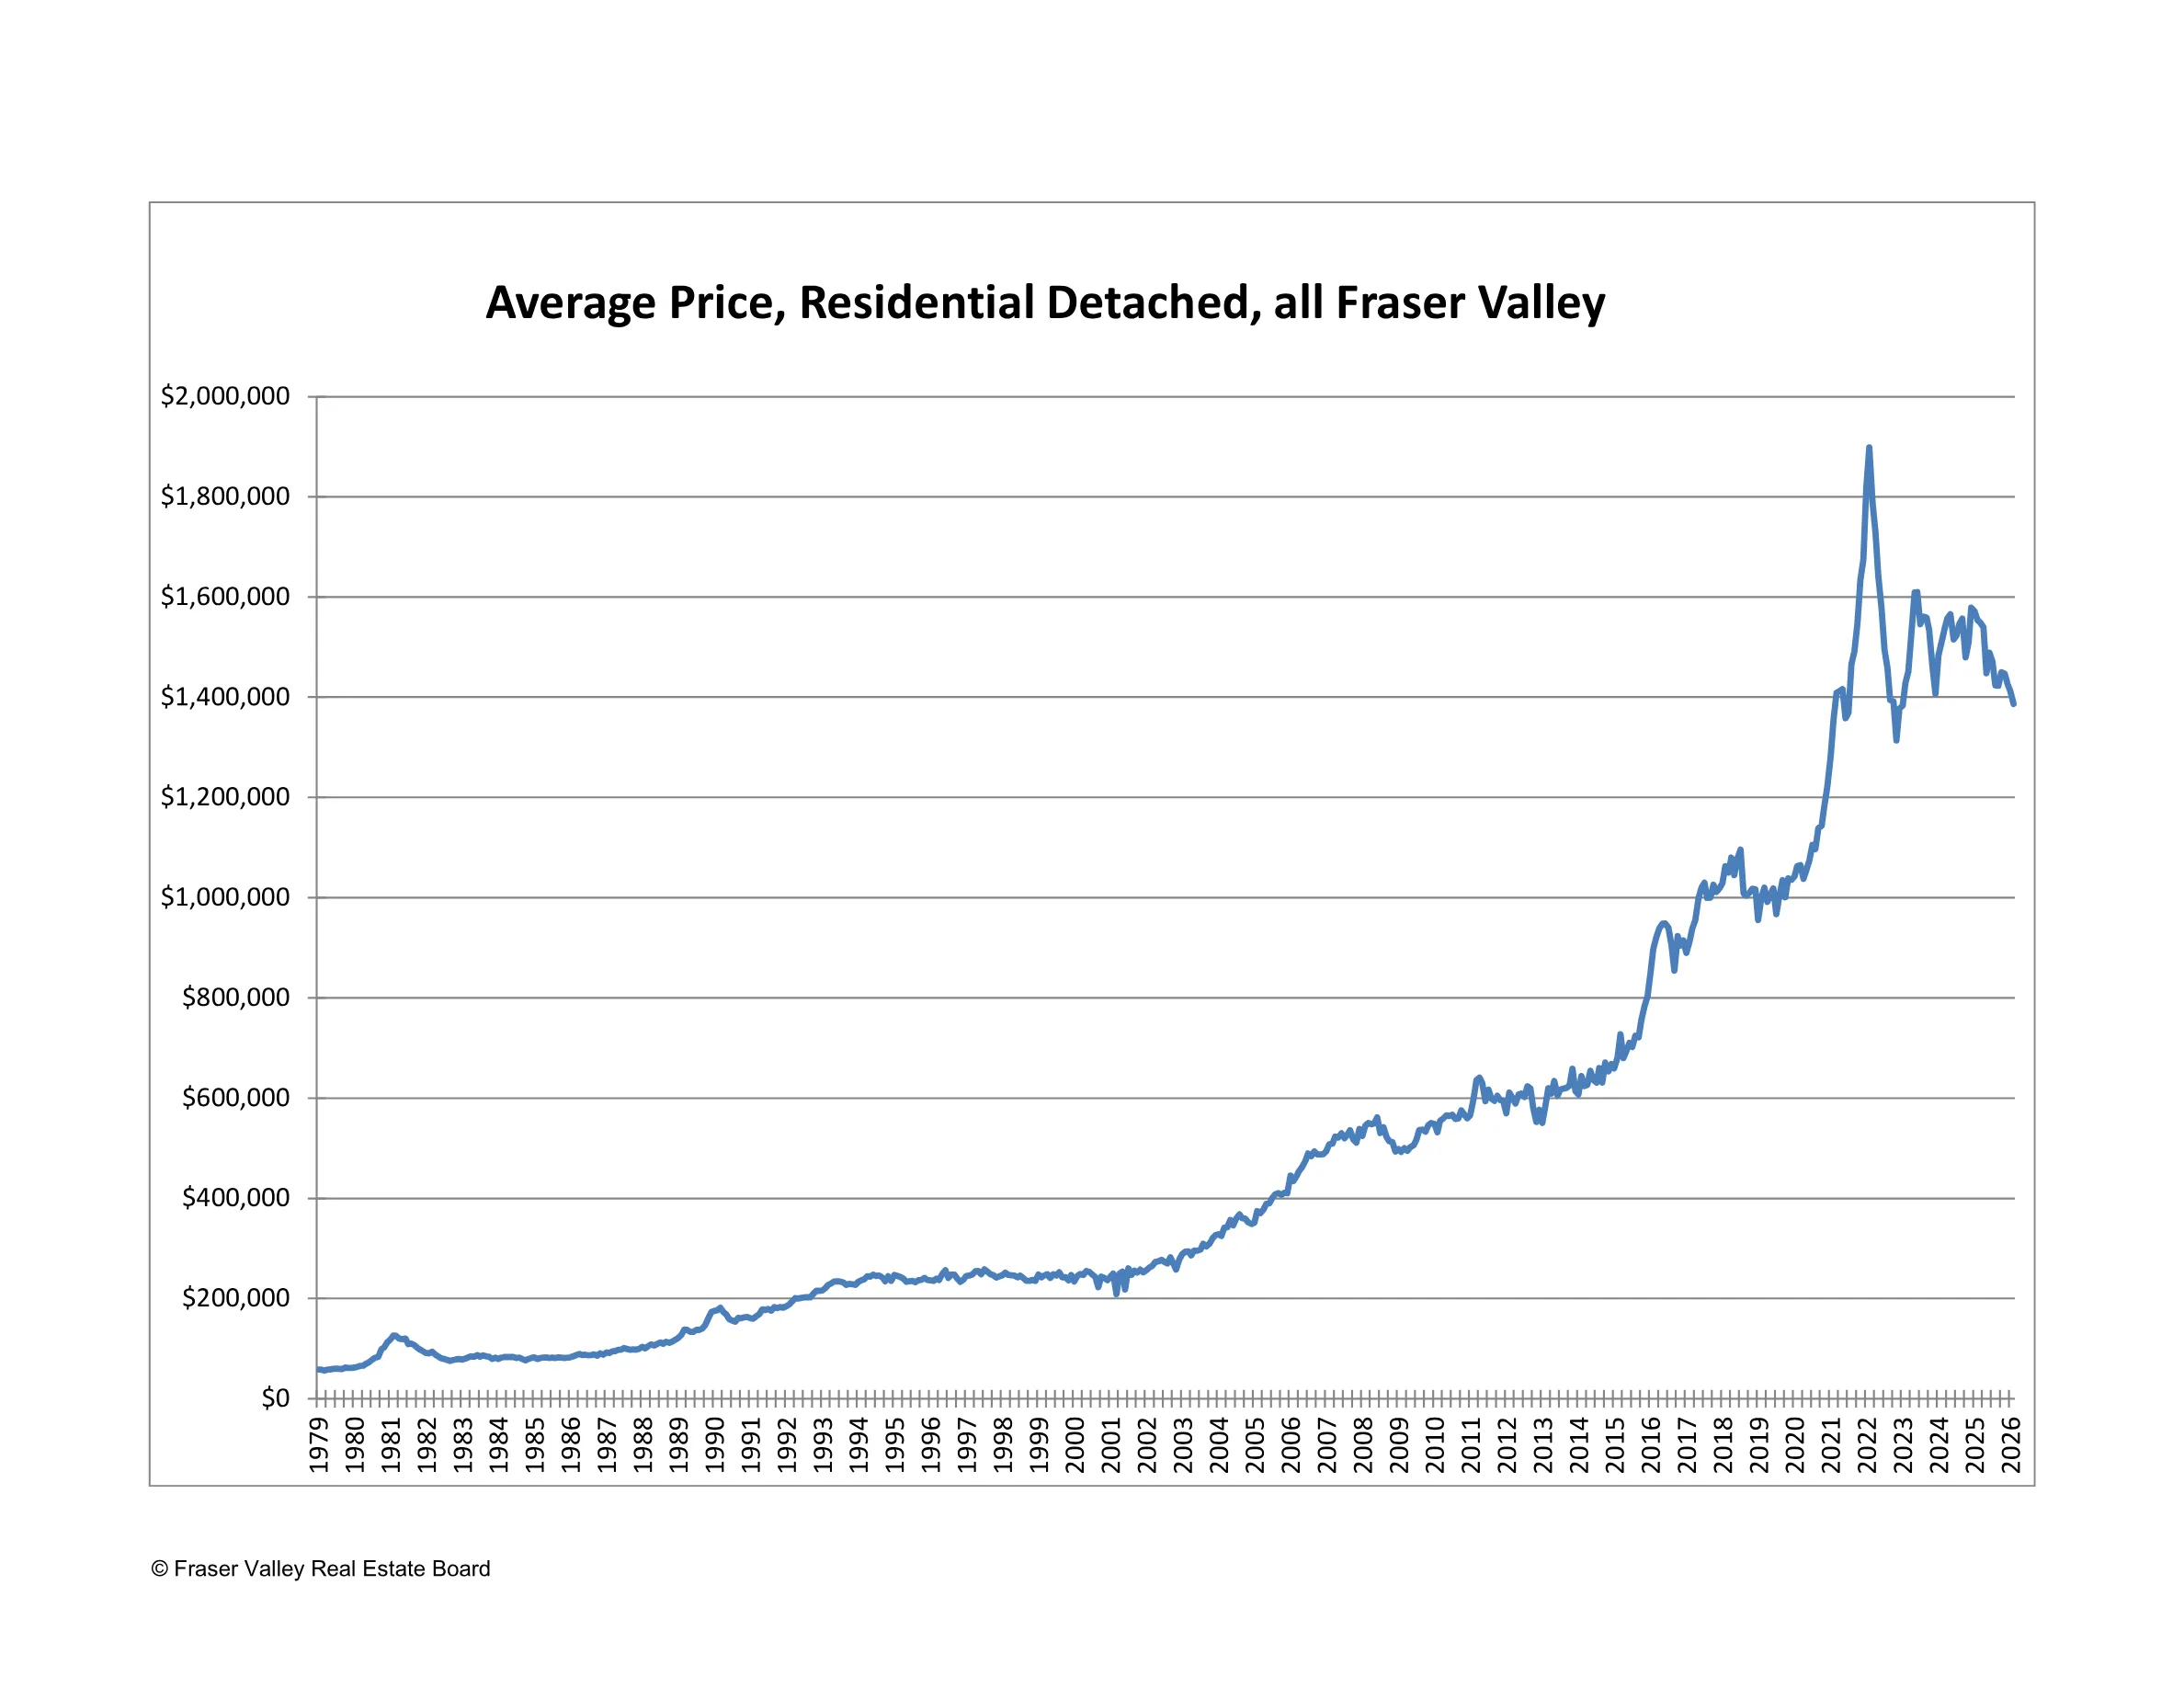
Benchmark Prices — Where Things Stand
The composite benchmark price for a typical Fraser Valley home came in at $895,100 in February, down 0.2% from January and down 7.7% year-over-year. Prices have been softening steadily, and February was no exception.
Here's how benchmark prices look across property types for the Fraser Valley board area:
| Property Type | Benchmark Price | MoM Change | YoY Change |
|---|---|---|---|
| Detached | $1,370,900 | -0.2% | -8.6% |
| Townhouse | $770,700 | -0.3% | -7.1% |
| Apartment | $488,300 | -0.1% | -8.9% |
| Composite (All Types) | $895,100 | -0.2% | -7.7% |
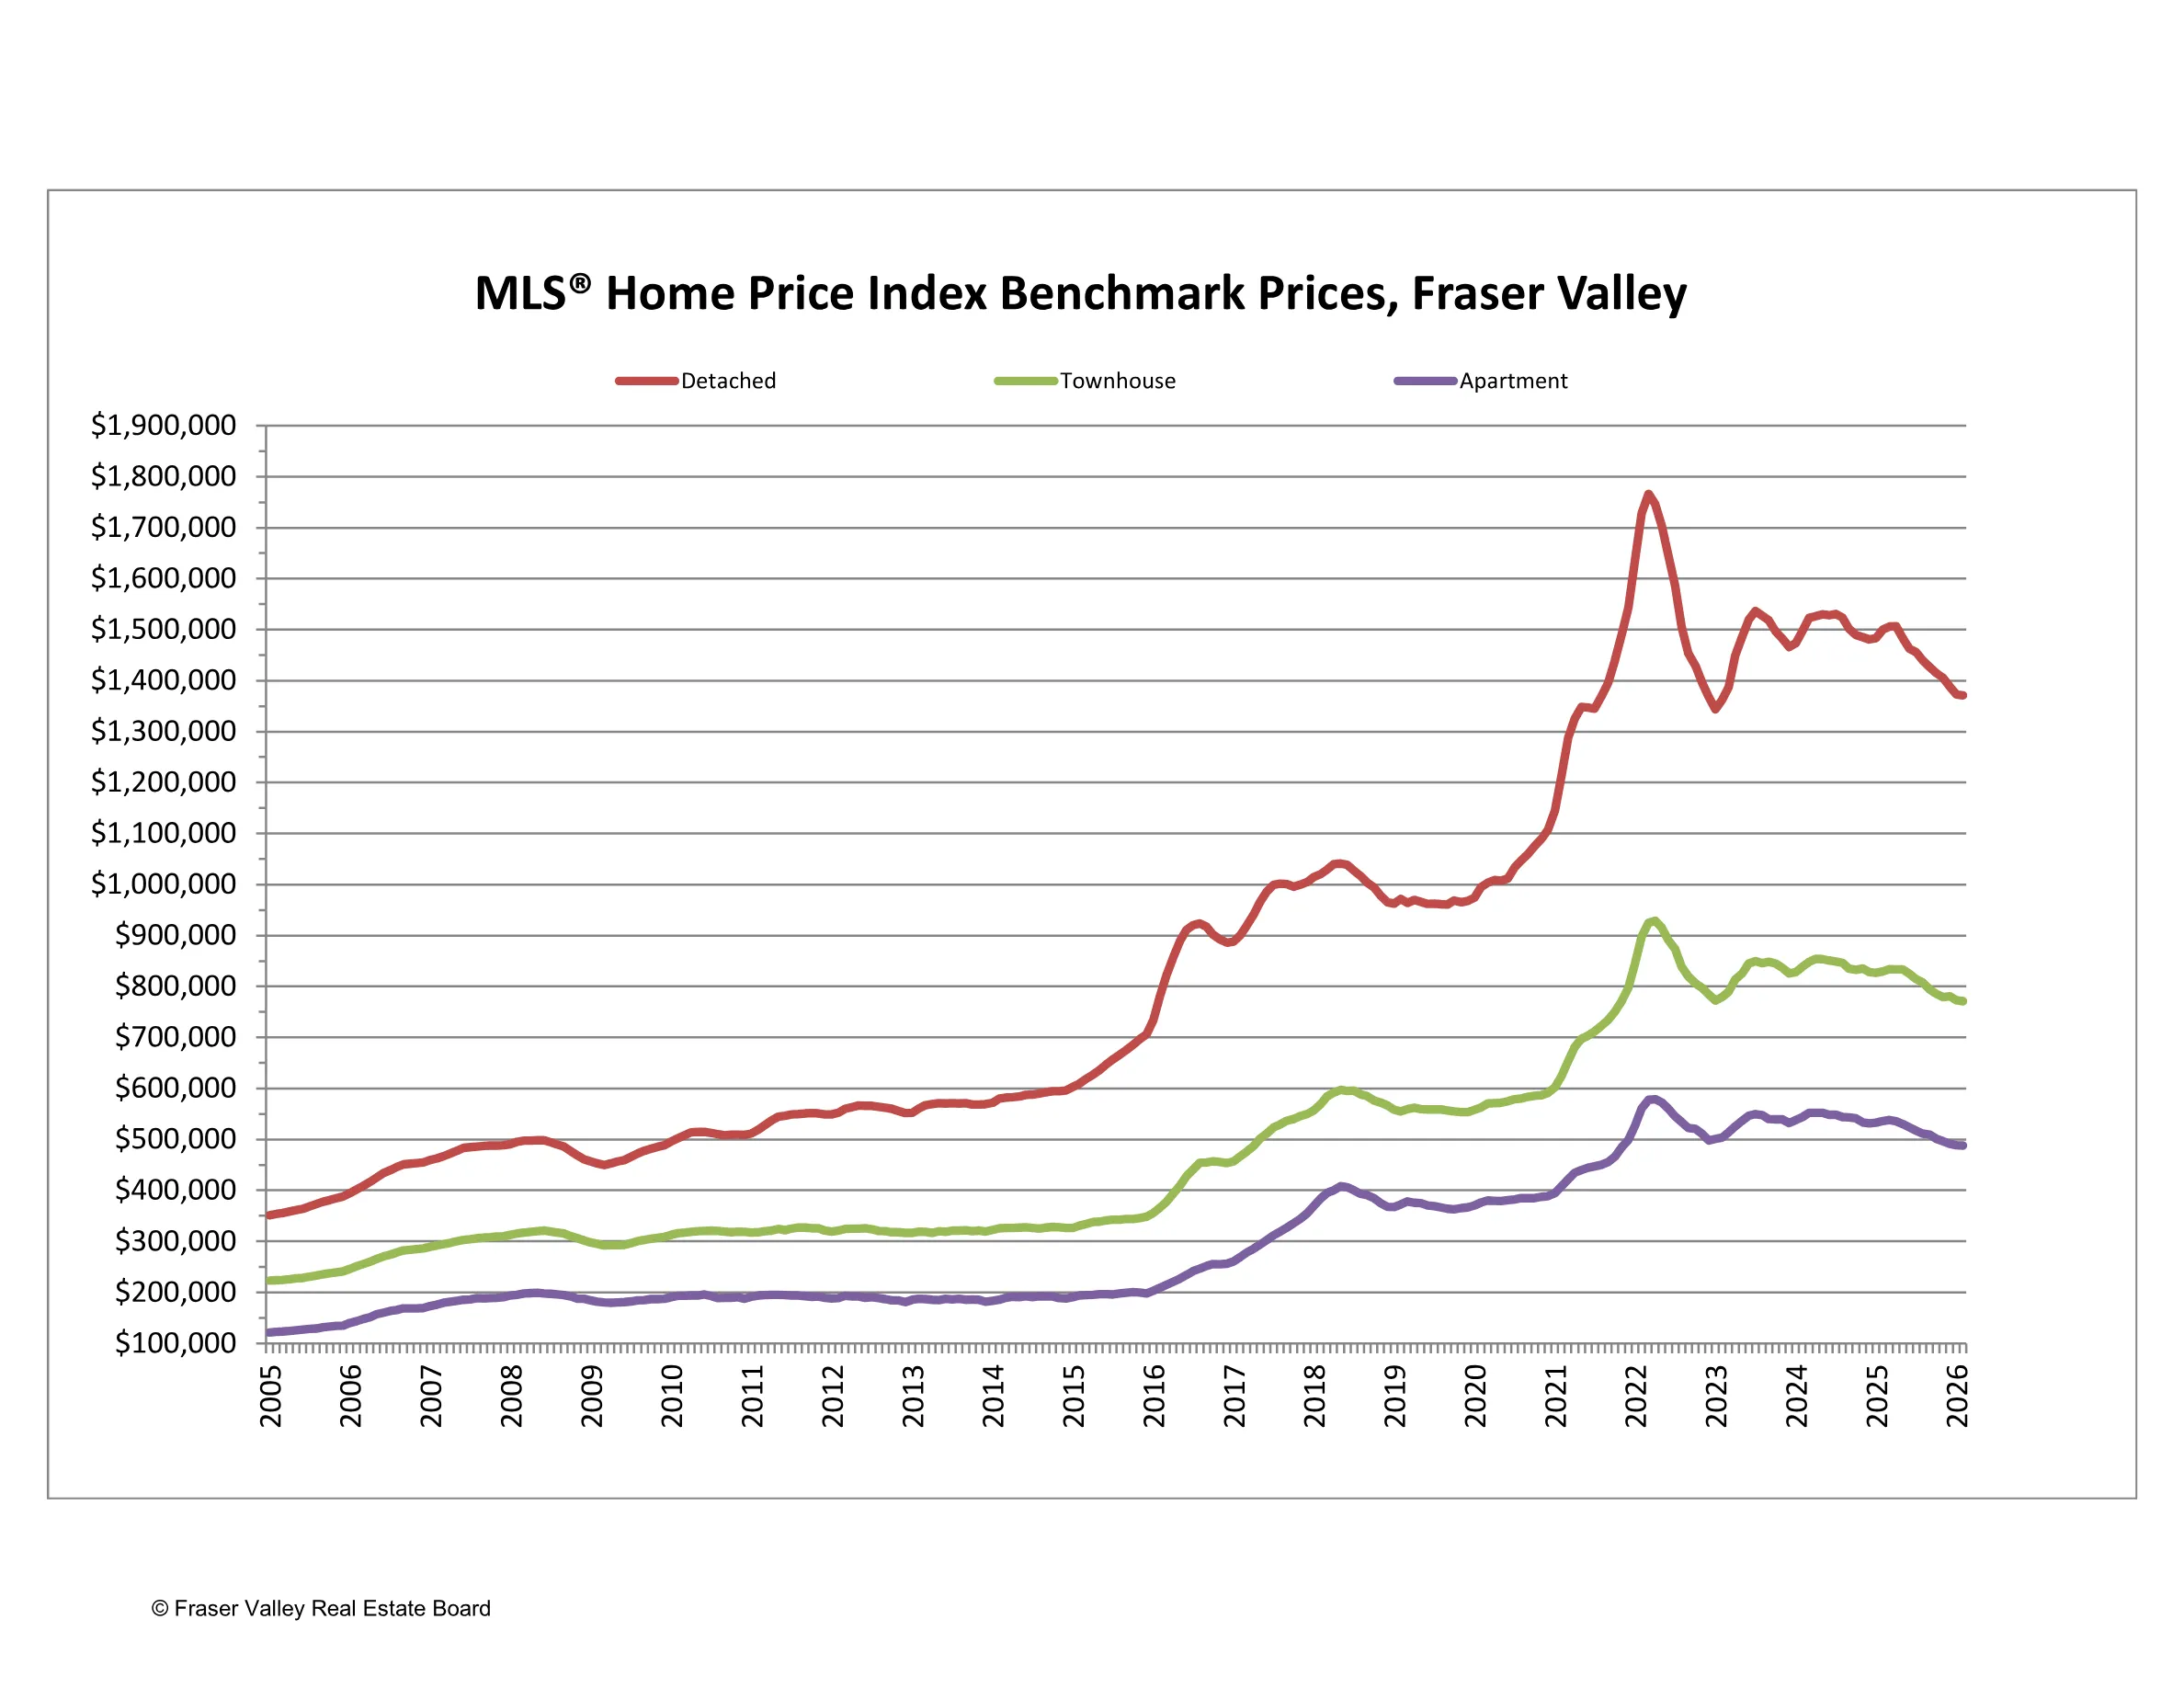
Every property type is down year-over-year, with apartments seeing the steepest decline at nearly 9%. For buyers, this is significant — you're getting meaningfully more value compared to a year ago.
Surrey Spotlight — The Local Numbers
Surrey is the largest city in the Fraser Valley, and where most local activity happens. Here's a closer look. The City of Surrey (combining North Surrey, Central Surrey, Cloverdale, and South Surrey excluding White Rock) saw:
| Property Type | Sales | Benchmark Price | MoM Change | YoY Change |
|---|---|---|---|---|
| Detached | 119 | $1,461,300 | -0.5% | -9.7% |
| Townhouse | 114 | $789,800 | +0.1% | -7.6% |
| Apartment | 101 | $479,100 | -0.4% | -8.9% |
A few standout points here. Surrey detached homes are down almost 10% year-over-year, which represents over $150,000 in price reduction on a typical home compared to February 2025. Townhouse prices in Surrey were essentially flat month-over-month, which could be an early sign of stabilization in that segment.
By Surrey Sub-Area
| Sub-Area | Detached Benchmark | MoM | YoY |
|---|---|---|---|
| Central Surrey | $1,372,700 | -1.5% | -10.2% |
| Cloverdale | $1,347,000 | -0.7% | -10.5% |
| North Surrey | $1,348,600 | +1.0% | -10.5% |
| South Surrey / White Rock | $1,722,800 | -0.3% | -7.6% |
Central Surrey and Cloverdale have seen the steepest corrections at over 10% year-over-year. North Surrey had a slight bounce this month, but is still down significantly from a year ago. South Surrey and White Rock are holding up a bit better, but still down nearly 8%.
How Long Homes Are Taking to Sell
Time on market is another key indicator of where things stand. Across the Fraser Valley in February:
| Property Type | Avg. Days to Sell |
|---|---|
| Detached | 47 days |
| Townhouse | 39 days |
| Apartment | 45 days |
Townhouses continue to move the quickest, which makes sense — they're often the sweet spot in terms of space and price for families. Detached homes and apartments are both sitting around 6–7 weeks, which gives buyers time to make considered decisions without the frantic pace of a few years ago.
Across the Fraser Valley
The picture is similar across the broader region. Here's a snapshot of benchmark prices by community (all property types combined):
| Area | Benchmark Price | MoM | YoY |
|---|---|---|---|
| Fraser Valley Board (All) | $895,100 | -0.2% | -7.7% |
| Surrey | $944,800 | -0.8% | -8.5% |
| Langley | $963,800 | +0.1% | -6.9% |
| South Surrey & White Rock | $1,041,000 | -0.5% | -7.9% |
| North Delta | $1,093,600 | -0.1% | -9.0% |
| Abbotsford | $740,300 | -0.5% | -6.7% |
| Mission | $844,000 | 0.0% | -10.0% |
Mission had the steepest year-over-year decline at 10%, while Abbotsford is holding up relatively better at -6.7%. Langley was essentially flat month-over-month, which is interesting given the new builds and development activity happening there.
What This Means for Buyers and Sellers
If You're Buying
This is genuinely one of the best buyer's markets in years. There are more homes to choose from, prices are lower than they were a year ago, and sellers are often willing to negotiate. The 10% sales-to-active ratio means buyers aren't competing against a pile of other offers like the bidding wars of 2021–2022.
If you've been pre-approved and waiting on the sidelines, this window — before the spring market heats up — could be a smart time to move. Interest rates have come down from their peaks, and there's good value to be had especially in the townhouse and apartment segments.
If You're Selling
It's a tougher market for sellers right now, no question. With inventory well above average and sales below normal levels, pricing strategy is absolutely critical. Homes that are priced right from day one are still selling — but overpriced listings are sitting and going stale.
If you're thinking about listing for spring, now is the time to prepare. Get your home show-ready, work with your realtor on a competitive pricing strategy, and be realistic about where the market is today versus where it was a year ago.
✅ Bottom Line
Looking Ahead — What to Expect in March
Heading into March, expect activity to pick up further as the spring market begins. More listings should come on as sellers who held off in January and February make their move. The big question is whether buyer demand keeps pace with that new supply.
Economic uncertainty — including tariff concerns and global trade tensions — continues to weigh on confidence. Many households are in a wait-and-see mode, which is understandable. But for those with the financial position to act, the current conditions offer real opportunity.
The March numbers will be posted here next month. In the meantime, if you have questions about what's happening in your specific neighbourhood or want to understand what these numbers mean for your situation, don't hesitate to reach out.
Have Questions About the Market?
Whether you're thinking about buying, selling, or just want to understand what's happening in Surrey real estate — I'm here to help.
